
How to Estimate Market Size for a New Product
A market size estimate is an argument, not a lookup. Here is the TAM/SAM/SOM structure, two methods, a worked bottom-up example and where to find credible inputs for free.
April 30, 20237 min read

Written by Konstantin Dolgan, Ph.D., NPDP
Founder & CEO, Product Development Engineer
Published April 30, 2023Updated September 2, 2026
A market size estimate is not a number you look up. It is an argument you build from a handful of inputs you can defend, and its value comes from the assumptions being visible — so an investor, a retailer or your own team can challenge one input rather than dismiss the whole figure.
This guide walks through the TAM/SAM/SOM structure, two methods for building the numbers, a worked example, credible free data sources, and the mistakes that make a forecast unusable.
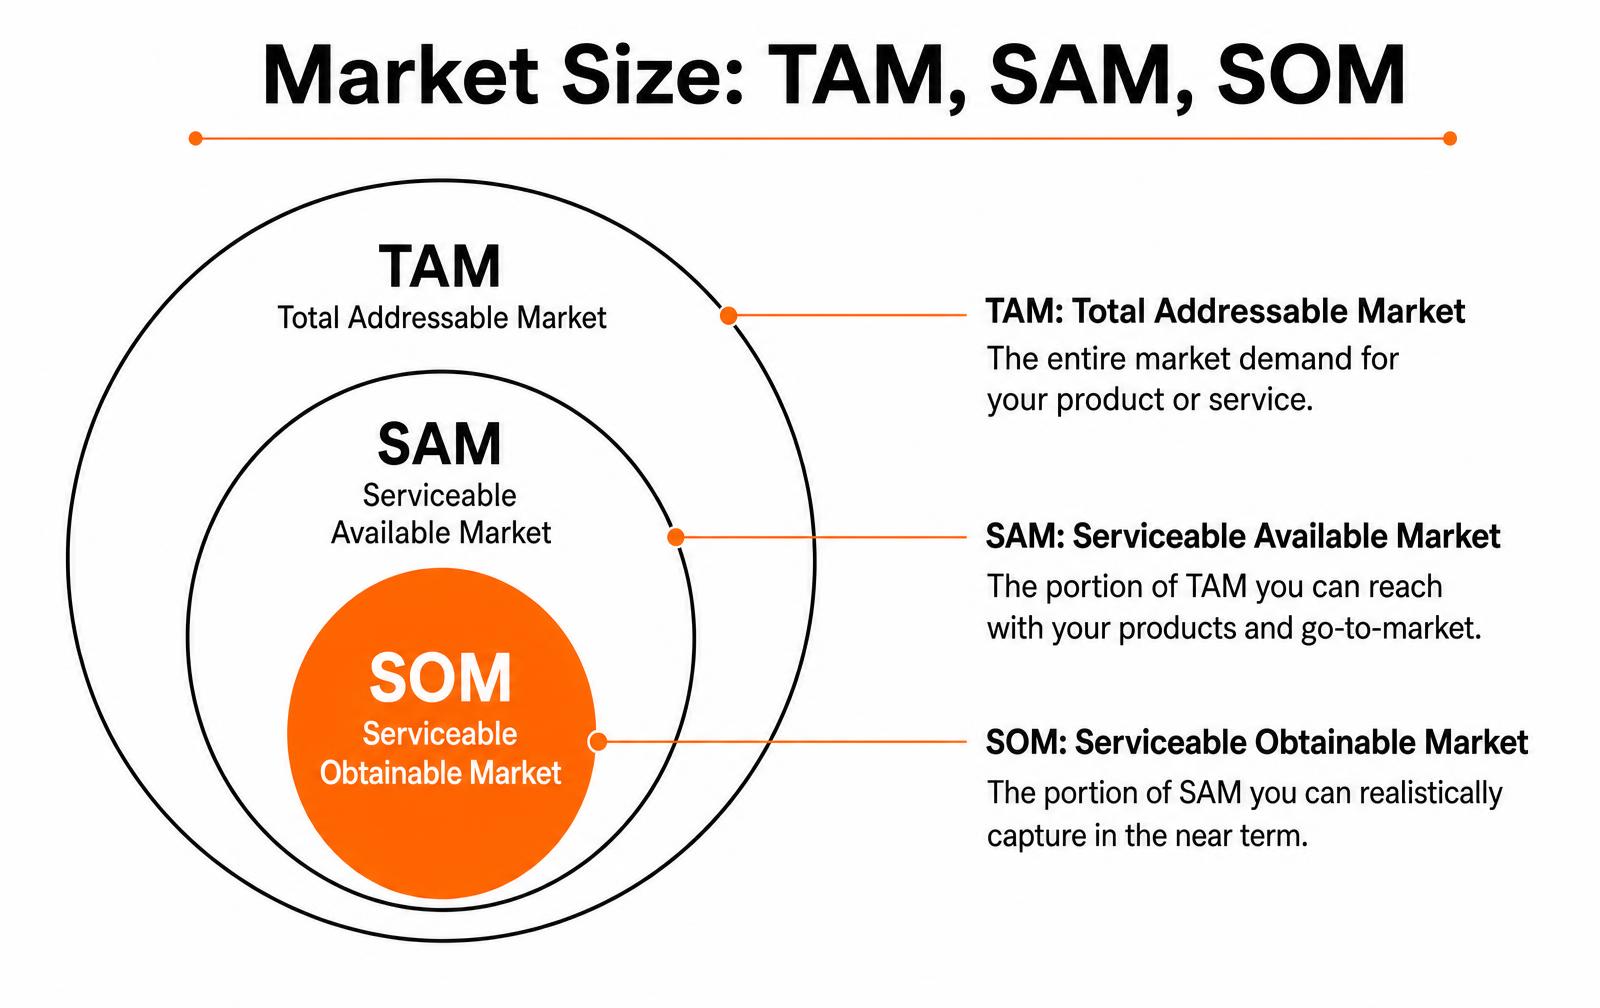
The three numbers you actually need
Metric | What it answers | How it is usually wrong |
|---|---|---|
TAM — total addressable market | If everyone who could buy this did, how large is the annual spend? | Defined so broadly it includes people who will never buy |
SAM — serviceable available market | How much of that can you reach with this product, in these channels, in these regions? | Skipped entirely, jumping from TAM to revenue |
SOM — serviceable obtainable market | What can you realistically capture in the first one to three years? | Set as a round share of TAM (“just 1%”) instead of built from capacity |
“We only need 1% of a $10 billion market” is not a forecast. It is the absence of one, and experienced readers treat it that way.
Two ways to build the number
Do both. When top-down and bottom-up land within the same order of magnitude, you have a usable estimate. When they diverge wildly, one of your assumptions is wrong and you have learned something more valuable than the number.
Approach | How it works | Best for | Risk |
|---|---|---|---|
Top-down | Start from published industry revenue, then narrow by segment, geography and channel | Established categories with reported data | Inherits someone else's category definition |
Bottom-up | Units × price × buyers reachable through real channels | New categories and niche products | Sensitive to the buyer-count assumption |
Value-based sanity check | What the product saves or earns a buyer, times plausible adoption | B2B and industrial products | Overstates willingness to pay |
A worked bottom-up example
Suppose you are launching a $180 accessory for professional dog groomers in the United States.
Step | Input | Source or logic | Result |
|---|---|---|---|
1. Buyer universe | ~120,000 grooming establishments and self-employed groomers | Government occupation and business-count data | 120,000 |
2. Relevant subset | 60% handle the volume that justifies the tool | Trade association data and interviews | 72,000 |
3. Units per buyer | 1.4 units, some buy a spare | Product logic | 100,800 units |
4. Price | $180 retail | Pricing plan | TAM ≈ $18.1M/yr replacement-adjusted |
5. Reachable channels | Two distributors plus direct, covering ~55% | Channel research | SAM ≈ $10.0M |
6. Year-one share | 6% of SAM given one salesperson and one trade show | Capacity-based, not aspiration | SOM ≈ $600K |
Each row can be argued with independently, which is exactly the point. If a reviewer thinks 60% should be 35%, the model updates in seconds instead of collapsing.
Where to get credible inputs without paying for a report
- Census and government statistics for business counts, household counts and industry revenue by NAICS code.
- Bureau of Labor Statistics for occupation counts when your buyer is a profession.
- Trade associations for category-level shipment and membership data, often free in press releases.
- Public company filings for segment revenue, unit volumes and channel mix in your category.
- Amazon and retailer data for review counts, ranks and price bands as a proxy for velocity.
- Keyword and search volume tools for demand direction, not absolute size.
- Twenty customer interviews, which will correct more assumptions than any report.
Cite the source and the date for every input in a footnote row. An estimate that shows its sources survives due diligence; one that does not gets discounted entirely.
Mistakes that make a forecast unusable
- Sizing the category rather than the product — “the $60B pet market” when you sell one grooming tool.
- Confusing revenue with spend on your product type.
- Using global TAM when you can only ship domestically in year one.
- Assuming replacement cycles that flatter the model.
- Ignoring competitors already holding the shelf and channel relationships.
- Treating a market research report headline as a substitute for your own arithmetic.
- Building the model in prose instead of a spreadsheet anyone can adjust.
Turning the estimate into a decision
The estimate exists to answer one question: does the obtainable revenue justify the development and tooling investment at your target margin? Run it against three scenarios — conservative, expected and optimistic — and check the conservative case still clears your break-even. If it does not, change the product, the price or the channel before writing engineering requirements.
Market sizing is one input into product discovery. Our product discovery process pairs it with customer interviews and competitive teardown, and our cost guide covers the investment side of the same equation.
Sanity checks before you show the number to anyone
Every market size estimate should survive four quick tests. They take an hour and prevent the most common credibility failures in an investor or licensing conversation.
Check | How to run it | Pass condition |
|---|---|---|
Order-of-magnitude agreement | Compare your bottom-up SOM with a top-down share estimate | Within roughly 3x of each other |
Category cross-check | Compare against a known adjacent category's retail sales | Your number is a plausible fraction of it |
Unit-count reality | Divide SOM revenue by price to get units per year | The units can actually be manufactured and shipped |
Channel capacity | Count the doors, sites or reps needed to sell those units | The channel plan can physically carry the volume |
The unit-count test catches more bad forecasts than any other. A $6 million SOM on a $180 product means about 33,000 units a year, roughly 2,800 a month — a real tooling program, a real warehouse and a real support load. If the plan assumed a contract manufacturer and one founder, the number is wrong or the plan is.

Sizing three common business models
Model | Core unit | Formula | Input to nail down |
|---|---|---|---|
One-time hardware sale | Units per year | Buyers x adoption rate x price | Replacement cycle length |
Hardware plus consumable | Attach rate | Installed base x consumables per year x price | Churn of the installed base |
B2B equipment | Facilities | Sites x units per site x price / replacement years | Budget cycle and procurement lead time |
Licensed product | Royalty base | Licensee unit volume x wholesale price x royalty rate | Realistic licensee volume, not your own forecast |
Free and low-cost data sources worth citing
- US Census County Business Patterns — establishment counts by NAICS code, the cleanest way to count B2B buyers.
- Bureau of Labor Statistics OES data — employment counts by occupation, ideal for professional-tool markets.
- USDA, DOT and state licensing registries — farm, fleet and facility counts that no paid report improves on.
- Amazon and retailer category ranks — directional velocity for consumer products when converted carefully.
- Import records (HS codes) — annual import volume for a product category, a strong upper bound on US demand.
- Trade association member counts — small, specific, and usually free to cite with attribution.
Key takeaways
- Build the number bottom-up first, then check it top-down; agreement within an order of magnitude is the goal.
- Convert every revenue figure back to annual units and ask whether you could actually make and ship them.
- Cite the source and date of every input in the model — a footnoted estimate survives scrutiny that a confident number does not.
- The estimate exists to support a go, refine or stop decision, not to produce an impressive slide.
Frequently asked questions
What is the Difference Between Tam, Sam and Som?
TAM is total annual spend if every possible buyer bought. SAM narrows that to buyers you can actually reach with this product, in your channels and regions. SOM is what you can realistically capture in the near term given your sales capacity, budget and competition — it is the only one of the three that should drive planning.
How do you estimate market size for a product that does not exist yet?
Size the problem, not the product. Count the people or businesses that currently pay to solve it another way, estimate what they spend on that alternative, and model what fraction would switch at your price. Twenty structured customer interviews will validate the switching assumption faster than any secondary research.
Is a top-down or bottom-up market estimate better?
Bottom-up is more defensible because every assumption is visible and adjustable. Top-down is a useful cross-check. Build both; if they agree within an order of magnitude, the estimate is usable, and if they do not, find which assumption is wrong before proceeding.
How accurate does a market size estimate need to be?
Accurate enough to make a go/no-go decision. If the conservative case comfortably clears break-even, extra precision changes nothing. If the answer flips between the conservative and optimistic cases, that is the signal to spend more on primary research before committing to tooling.
Where can I find free market data for a new product?
Census business and household counts, Bureau of Labor Statistics occupation counts, trade association shipment data, public company segment reporting, and retailer review and rank data. Combined with customer interviews, these usually produce a better-grounded estimate than a purchased category report.
Turning a market size into a production forecast
A market estimate is only useful when it becomes a number of units to build. That translation is where most forecasts break, because the funnel from addressable market to first-year shipments has several stages and each one multiplies down. Doing the arithmetic explicitly prevents the classic mistake of tooling for a fraction of a percent of a large market that never materializes.
From market size to first-year units
Step | Example figure | Notes |
|---|---|---|
Serviceable market (units/year) | 500,000 | Your geography and segment only |
Reachable through your channels | 150,000 | Limited by distribution, not demand |
Aware of your product in year one | 15,000 | Function of marketing budget |
Convert to purchase | 1,200 | Use a category conversion benchmark |
Adjust for launch timing | 900 | Partial year of availability |
Add safety and replacement stock | 1,000 | Build quantity for planning |
Build the first production run against the bottom of this funnel, not the top. Inventory that does not sell is the most expensive mistake available to a hardware business, and a second run ordered because you sold out is a good problem.
Forecast sanity checks
- Compare your implied market share to real incumbents in the category.
- Check whether the marketing budget supports the awareness figure.
- Confirm the channel can physically move the units assumed.
- Model a downside case at half the volume and check it survives.
- Set the reorder trigger before the first run ships.
Key takeaways
- Translate market size into units through an explicit, multiplying funnel.
- Build the first run against the conservative end of the estimate.
- Check implied market share against real incumbents before believing a forecast.
Sanity-checking a market size estimate before you present it
Every market size estimate is wrong; the question is whether it is wrong in a way that changes the decision. Before a number goes into a deck, run it through three independent checks. If two of the three land within roughly the same order of magnitude, the estimate is good enough to plan against. If they disagree wildly, the disagreement itself is the finding — usually it means the market definition is doing too much work.
Cross-check | How to run it | What a failure looks like |
|---|---|---|
Top-down vs bottom-up | Size the market from industry reports, then rebuild it from unit counts and price | A 10x gap: one of the two is counting a different market |
Revenue of incumbents | Add up the disclosed revenue of the three largest players in the category | Your "total market" is smaller than the leader's sales |
Share plausibility | Divide your revenue target by the estimate | Requires more than 5 – 10% share in year three |
Replacement cycle | Installed base divided by average product life | Implied annual demand exceeds anything the channel could absorb |
Channel capacity | Number of outlets multiplied by realistic units per outlet | Needs shelf space that does not exist |
The share plausibility test kills more forecasts than any other. A new entrant taking double-digit share of an established category inside three years is rare enough that it should be argued for explicitly, with a named reason — a structural cost advantage, an exclusive channel, a patent position. Absent that reason, model 1 to 3% and see whether the business still works. If it does not, the problem is the business model, not the estimate.
Free and low-cost data sources worth using
- Census Bureau County Business Patterns — establishment counts by NAICS code, the backbone of most B2B bottom-up models.
- Bureau of Labor Statistics — employment by occupation, a good proxy for the number of people who would actually use a professional tool.
- USITC and Census trade data — import volumes by HTS code, often the fastest way to size a physical product category.
- Industry association reports — usually free to members and far closer to reality than a syndicated market report abstract.
- Marketplace listings and review counts — imperfect, but review velocity on major marketplaces gives a defensible floor for consumer unit volumes.
- Public company filings — segment revenue disclosures let you triangulate a category from the top down at no cost.
Write the assumptions on the same slide as the number. A market size estimate presented without its inputs invites a debate about the conclusion; presented with its inputs, it invites a debate about the assumptions, which is the conversation that actually improves the plan.
Keep the model in a spreadsheet where a single cell change re-runs the estimate, and revisit it after the first hundred customers — real conversion and repeat data will beat any secondary source you started with.
Need a market estimate you can build a production plan on?
Work with LA NPDT: if you are moving from here to execution, start with our product development consulting or talk to us about end-to-end product development.
Filed under:Uncategorized
Services related to this guide
- Free prototype cost calculatorFive to eight questions, an instant cost range for a first prototype.
- Prototype designLooks-like, works-like or pre-production: what each proves and what it costs.
- Rapid prototypingWorking prototypes in days, from 3D printing to vacuum casting.
- Best product development companiesHow the leading US firms compare, and which one fits your stage and budget.