Non-Invasive Glucose Monitoring Device: How It Works and Where It Stands
No non-invasive glucose monitor has FDA clearance for treatment decisions. Here is how each sensing approach works, why accuracy is hard, and what development costs.
February 5, 20206 min read

Written by Konstantin Dolgan, Ph.D., NPDP
Founder & CEO, Product Development Engineer
Published February 5, 2020Updated September 2, 2026
No non-invasive glucose monitoring device has FDA clearance for making insulin dosing decisions. Every cleared continuous monitor on the US market still puts a filament under the skin. Non-invasive approaches read glucose through skin optically or electrically, and the physics - not the product design - is what has kept them in development for four decades.
Why it is so hard
Physiological glucose sits around 70-180 mg/dL, which in tissue is a very small signal buried under water, hemoglobin, lipids and protein absorbing in the same bands. Temperature, hydration, skin thickness, pigmentation, motion and sensor placement all move the reading more than glucose does. A device must separate a weak analyte signal from much larger confounders, per person, all day.
The four sensing approaches
Approach | What it measures | Main obstacle | Maturity |
|---|---|---|---|
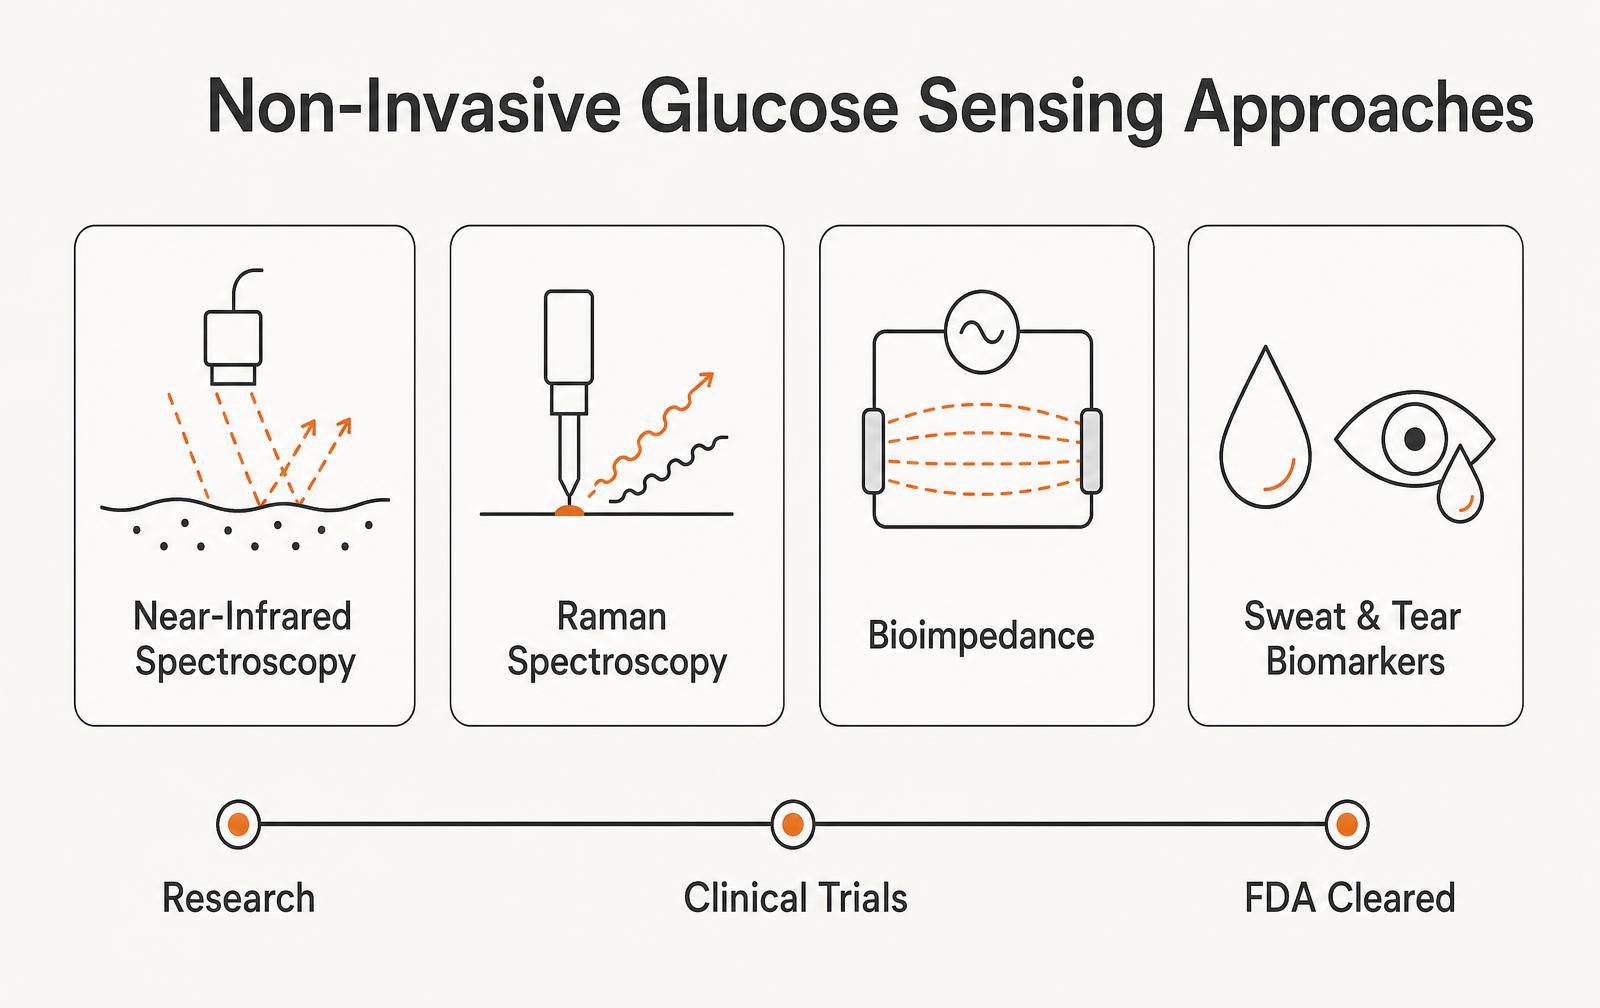
Near-infrared / mid-infrared | Absorption at glucose bands through skin | Water absorption and shallow penetration | Research and early clinical |
Raman spectroscopy | Inelastic scatter with a glucose-specific fingerprint | Very weak signal, tissue fluorescence, power | Clinical research |
Bioimpedance / dielectric | Changes in tissue electrical properties | Hydration and temperature dominate the signal | Consumer wellness claims only |
Sweat, tear and saliva biomarkers | Glucose in an interstitial-adjacent fluid | Lag, dilution and poor blood correlation | Research |
Photoacoustic | Ultrasound generated by optical absorption | Coupling, motion, complex hardware | Research |
The accuracy bar
- Cleared continuous monitors report MARD in the 8-10% range against laboratory reference.
- Consensus error grid analysis requires the overwhelming majority of readings in zones A and B, where an error would not cause harmful treatment.
- Performance must hold across skin tone, body mass, temperature and activity, not only in a lab cohort.
- Calibration drift over 7-14 days of wear is a common failure point for optical devices.
- A wellness device that shows trends only can avoid this bar - and also cannot claim to replace a meter.
Regulatory path
Path | Applies to | Typical duration | Typical cost |
|---|---|---|---|
Wellness / general trend claims | No diagnostic claim, no dosing | Immediate | Design and testing only |
510(k) | Substantially equivalent device | 6-12 months review | $150k-$500k plus studies |
De Novo | Novel low-to-moderate risk device | 10-18 months review | $500k-$2M with clinical data |
PMA | High-risk dosing-critical device | 1-3 years | $5M-$50M with pivotal trials |
A first-of-its-kind non-invasive monitor intended for dosing decisions has no predicate, so it faces De Novo or PMA with real clinical evidence. That is the actual reason products stall: the science is fundable, the pivotal trial is not, unless accuracy is already proven.
What it takes to develop one
- An optical or electrical front end with signal-to-noise budgeted before industrial design begins.
- A skin interface that controls pressure, temperature and contact - the single largest source of variance.
- Per-subject modeling and a calibration strategy that does not require a fingerstick.
- A clinical data set spanning skin tones, body types and glycemic excursions, not healthy volunteers at rest.
- Quality system, risk file and design controls under ISO 13485 and IEC 62304 from day one.
Teams that treat this as a wearable design problem burn a year before discovering their signal chain cannot resolve the analyte. Teams that treat it as a measurement physics problem first, then a product, get to a defensible answer faster. Our medical device development and prototyping groups work on that order of operations.
Why non-invasive glucose sensing is still hard
Optical and RF approaches to glucose sensing all fight the same problem: glucose is a weak signal buried under stronger confounders. Skin temperature, hydration, blood perfusion, pressure on the sensor site and even melanin change the measured response more than a clinically meaningful glucose shift does.
That is why demonstrations that look convincing in a lab, on a small cohort, on one skin type, so often fail when they meet real users. A device that reads well on a fasting subject in a controlled room is not the same product as one that reads well on a construction site in August.
Approach | Signal used | Main confounder | Maturity |
|---|---|---|---|
NIR spectroscopy | Absorption in 1,000-2,500 nm | Water, temperature drift | Research to early pilots |
Raman spectroscopy | Molecular scatter | Long integration time, laser safety | Research |
Bioimpedance / RF | Dielectric change | Hydration, sweat, contact pressure | Research |
Interstitial microneedle | Fluid sampling | Wear comfort, skin response | Commercial (minimally invasive) |
Enzymatic CGM filament | Electrochemical | Insertion, warm-up period | Commercial |
What a credible development plan includes
- A reference standard for every measurement: paired venous or CGM data, not self-reported values.
- Clarke error grid analysis reported alongside MARD, across the full glycemic range.
- A cohort that spans skin tone, body mass, age and perfusion, not a single demographic.
- Documented drift and recalibration behavior across days, not minutes.
- Environmental testing: temperature, humidity, motion artifact, sensor reseating.
- A regulatory strategy chosen early, because claim language drives the study design.
How to read a glucose sensing accuracy claim
Accuracy claims in this field are easy to misread. MARD (mean absolute relative difference) summarizes agreement with a reference, but a single MARD number hides where the errors occur. A device with a respectable overall MARD can still be dangerous if its errors cluster in hypoglycemia, where a wrong reading changes treatment. That is why the Clarke or Parkes error grid matters: it weights errors by clinical consequence, not by arithmetic size.
Ask three questions of any published figure. What was the reference method, and was it venous plasma or another sensor? How many paired points came from the low and high ends of the range, rather than the comfortable middle? And was the data collected on the same subjects used to calibrate the algorithm? Self-calibrated results on a training cohort are a demonstration, not evidence.
- Report MARD by glycemic range, not as a single pooled figure.
- Include the reference method and its own error bars.
- State how many subjects and how many paired points support each range.
- Separate training and validation cohorts explicitly.
- Disclose warm-up time, recalibration frequency and drop-out rate.
- Describe the failure mode when the sensor loses confidence.
Why a non invasive glucose monitoring device is so hard to build
Every few years a non-invasive glucose sensor is announced and then quietly disappears. The physics is the reason: glucose is present in interstitial fluid at very low concentration, and the optical or electromagnetic signals it produces are smaller than the confounding signals from temperature, hydration, skin tone, motion and sensor placement. A device that reads well in a lab on one subject frequently fails across a population.
Sensing approach | Principle | Main obstacle | Maturity |
|---|---|---|---|
Near-infrared spectroscopy | Absorption at glucose bands | Water and protein absorb far more strongly | Research to early clinical |
Raman spectroscopy | Inelastic scatter fingerprint | Weak signal, long integration times | Research |
Bioimpedance | Dielectric change with glucose | Hydration and temperature dominate | Consumer claims, weak evidence |
Photoacoustic | Light pulse to ultrasound | Motion and coupling artifacts | Research |
Interstitial microneedle (minimally invasive) | Enzymatic electrode | Not truly non-invasive | Commercial (CGM) |
Evidence and regulatory bar for a glucose claim
In the United States a device that measures glucose to inform treatment is a regulated medical device, and marketing a wellness wearable with a glucose readout does not avoid that. Accuracy is judged against reference plasma measurements, usually reported through MARD and Clarke or Parkes error grids, across a range that includes hypoglycemia — the region where consumer-grade sensors typically perform worst and where mistakes hurt patients.
- Reference method. Venous plasma on a laboratory analyzer, not a fingerstick meter, for pivotal data.
- Population coverage. Skin tone, BMI, age and both diabetes types; single-cohort data is not evidence.
- Dynamic conditions. Rapid rise and fall after meals, plus exercise and temperature swings.
- Standards. IEC 60601-1 and -1-2 for electrical safety and EMC, ISO 10993 for skin contact, IEC 62304 for software.
- Human factors. IEC 62366 usability work, since placement error is a primary source of bad readings.
- Cybersecurity. Any connected readout needs a documented threat model and update path.
Teams exploring sensing hardware usually get further by validating the physics on the bench before industrial design starts; our development team structures programs that way.
Sensing approaches and where each one stalls
Every non invasive glucose monitoring device program lives or dies on one number: mean absolute relative difference (MARD) against a lab reference across real physiological conditions. Here is where each modality sits.
Approach | Physical principle | Reported MARD | Main confounder | Status |
|---|---|---|---|---|
NIR / mid-IR spectroscopy | Glucose absorption bands | 10-25% | Water, temperature, skin tone | Research to pilot |
Raman spectroscopy | Molecular scattering | 8-20% | Weak signal, laser power limits | Research |
Photoacoustic | Light in, ultrasound out | 10-20% | Motion, coupling to skin | Research |
Bioimpedance | Tissue dielectric change | 15-30% | Hydration, sweat, temperature | Consumer wellness only |
Interstitial microneedle (minimally invasive) | Direct ISF sampling | 8-12% | Insertion site, 1-2h lag | Commercial (CGM) |
Clinical and regulatory path
Stage | Typical duration | Typical cost | Gate you must clear |
|---|---|---|---|
Benchtop and phantom studies | 3-6 months | $150,000-$400,000 | Repeatable signal, not just correlation |
Feasibility in healthy subjects | 4-8 months | $250,000-$700,000 | MARD under 20% before proceeding |
Pivotal clamp study | 9-18 months | $1.5M-$5M | Accuracy across glycemic range |
FDA submission (De Novo / PMA) | 9-24 months | $500,000-$2M | Clinical evidence and cybersecurity |
Post-market surveillance | Ongoing | $200,000+/yr | Real-world accuracy holds |
What separates credible programs from vapor
- They report MARD, not correlation coefficients — r-values hide clinically dangerous error.
- They test hypoglycemia specifically — most optical methods degrade badly below 70 mg/dL.
- They publish across skin tones and BMI — melanin and tissue thickness shift optical baselines.
- They have a calibration story — if it needs a fingerstick twice a day, it is not replacing anything.
- They budget for a clamp study — anyone promising clearance for under $2M has not read the guidance.
- They separate wellness claims from medical claims — the regulatory paths are not interchangeable.
If you are developing in this space, treat the sensor as a systems problem: optics, thermal control, motion rejection, and algorithm all move MARD together. Our medical device development team builds the verification plan before the first optical bench is assembled.
Key takeaways
- Glucose is a weak optical signal surrounded by stronger confounders.
- Credible claims need paired reference data and Clarke error grid analysis.
- Cohorts must span skin tone, perfusion and body composition.
- Regulatory strategy should shape the study design, not follow it.
We take medical and biosensing hardware from measurement feasibility through design controls and manufacturable product.
Work with LA NPDT: if you are moving from here to execution, start with our our product development process or talk to us about end-to-end product development.
Frequently asked questions
Is there an FDA-approved non-invasive glucose monitoring device?
No. As of 2026 the FDA has not cleared or approved any non-invasive glucose monitor for diabetes management, and it has publicly warned against smartwatches or rings that claim to measure blood glucose without piercing the skin.
How would a non-invasive glucose monitor work?
Most designs shine light into tissue and infer glucose concentration from how it is absorbed or scattered, using near-infrared or Raman spectroscopy. Others measure changes in tissue electrical impedance, or read glucose in sweat or tears rather than blood.
Why is non-invasive glucose measurement so difficult?
The glucose signal is tiny compared with water, hemoglobin and lipid signals in the same wavelength range, and it shifts with hydration, temperature, skin properties and sensor pressure. Isolating it reliably across a diverse population is the unsolved part.
What does it cost to develop a non-invasive glucose device?
Feasibility and a benchtop sensing proof typically run $250,000-$1M. A clinically credible wearable with design controls, verification and a pivotal study realistically requires $10M or more before market authorization.
Services related to this guide
- Product design servicesIndustrial design and CAD taken all the way to manufacturable files.
- Rapid prototypingWorking prototypes in days, from 3D printing to vacuum casting.
- Electronic design servicesSchematic, PCB layout, firmware and bring-up, through to production handoff.
- Product development examplesReal projects we designed, prototyped and shipped.