The Psychology of Perceived Quality: Weight, Texture, Sound, and Visual Cues
Perceived quality is crucial in product development, but because “quality” is a relative and complex concept, it has many definitions. A practical way to understand it is to br
April 28, 202610 min read

Written by Onega Ulanova, IRCA Lead Auditor, MS Eng. & Tech. Management, Executive MBA
Co-Founder, Quality Management Executive & Lead Auditor
Published April 28, 2026Updated September 2, 2026
Perceived quality is how a customer judges a product in the first few seconds. This happens before they read a spec sheet, review, or warranty claim. In product development, we measure this through specific traits. These include performance, features, reliability, and durability. Sensory cues like weight, texture, and sound also shape how users see a product.
Perceived quality is a key part of product development. It often decides if a design succeeds or fails. To understand it, we must first look at what quality means. Defining quality is hard. Many experts have studied it from different angles over the years.
Quality is both a deep idea and a practical concept for daily life. It describes how products work. It also measures the work of people, teams, and whole nations. Quality is relative. Its meaning changes based on the context and the rules used to judge it.
Scholars use many models to explain this complex topic. Different tasks need different views. Each view has its own pros and cons for measurement and use. Because of this, a single definition of quality likely does not exist.
A practical approach is to break quality into separate dimensions and assess each one individually. These dimensions include:
- Performance (core product characteristics)
- Features (additional enhancements)
- Reliability (likelihood of failure)
- Conformance (alignment with specifications)
- Durability (expected lifespan)
- Serviceability (ease and speed of repair)
- Aesthetics (appearance and finish)
- Perceived quality (reputation and intangible impressions).
Quality Attributes and How Perceptions Form
Quality attributes are the functional and social traits of a product. You notice some traits through direct use. These are called experience attributes. Other traits like durability and reliability take time to show. You might need expert help to judge these credence attributes.
Shoppers judge quality by mixing inner and outer cues. They use facts from past experience and expert knowledge. Personal tastes and the setting also matter a lot. These factors all work together to shape Perceived Quality.
Quality is both a physical and mental process. It starts with sensory input. Human senses provide the base to judge product traits. This sensory experience is vital to Perceived Quality.
Frameworks for Understanding Product Quality
- Garvin’s Framework of Product Quality.
Garvin’s framework identifies several independent dimensions of product quality, each contributing to the overall evaluation.
The meaning of “perceived quality” varies across fields. Engineers check sensory traits like touch, smell, sound, taste, and look. Marketers focus on brand image, fame, and ads.
This shows a key change from Garvin’s first definition. In his model, perceived quality links mostly to fame. Aesthetics refers to sensory traits like how a product feels or looks.
- The Perceived Quality Framework (PQF).
Engineers often ask a core question. Which Perceived Quality traits should they rank first to please customers? They also must find ways to measure the value of each trait.
Figure 1. Attributes levels of the PQF (source –Chalmers: Fulltext)
Researchers built the Perceived Quality Framework (PQF) to help. This tool sorts quality traits into a clear list. The PQAIR method also helps with choices and ranking.
The PQF shows an engineering view based on car industry studies. These products are very complex. Engineers sort Perceived Quality traits by human sensory systems:
- Visual quality
- Tactile quality
- Auditory quality
- Olfactory quality
- Gustatory quality.
This structure helps designers find key traits. It shows how they build Total Perceived Quality (TPQ). This framework started in the car industry. It works well for complex goods and allows for deep study.
3. The PQAIR Method
The Perceived Quality Attributes Importance Ranking (PQAIR) method helps engineers assess the relative importance of different Perceived Quality attributes. It combines objective measurements with subjective customer evaluations.
Figure 2. PQAIR method analysis procedure (source –Chalmers: Fulltext)
Contact us today to learn how LA NPDT can assist in realizing your project.
The method works by ranking all ground traits by weight. You can base these ranks on:
• Internal skills, like expert reviews
• External data, like surveys, talks, user feedback, and big data
Engineers can also apply the method to specific sensory categories, helping define precise product requirements and improve Perceived Quality outcomes.
Sensory-Based Perceived Quality
In the real world, buyers use their senses to judge products. They often make fast choices without deep thought. They use sight, touch, and sound. these steps drive Perceived Quality.
Color, texture, and material weight immediately shape impressions. These signals extend beyond the product itself, influencing perceptions of brand value and reinforcing judgments about Perceived Quality.
First Impressions and Sensory Signals
Human minds favor speed and ease. People make quick calls based on small bits of data. When seeing a product, people judge its look, feel, and sound at once.
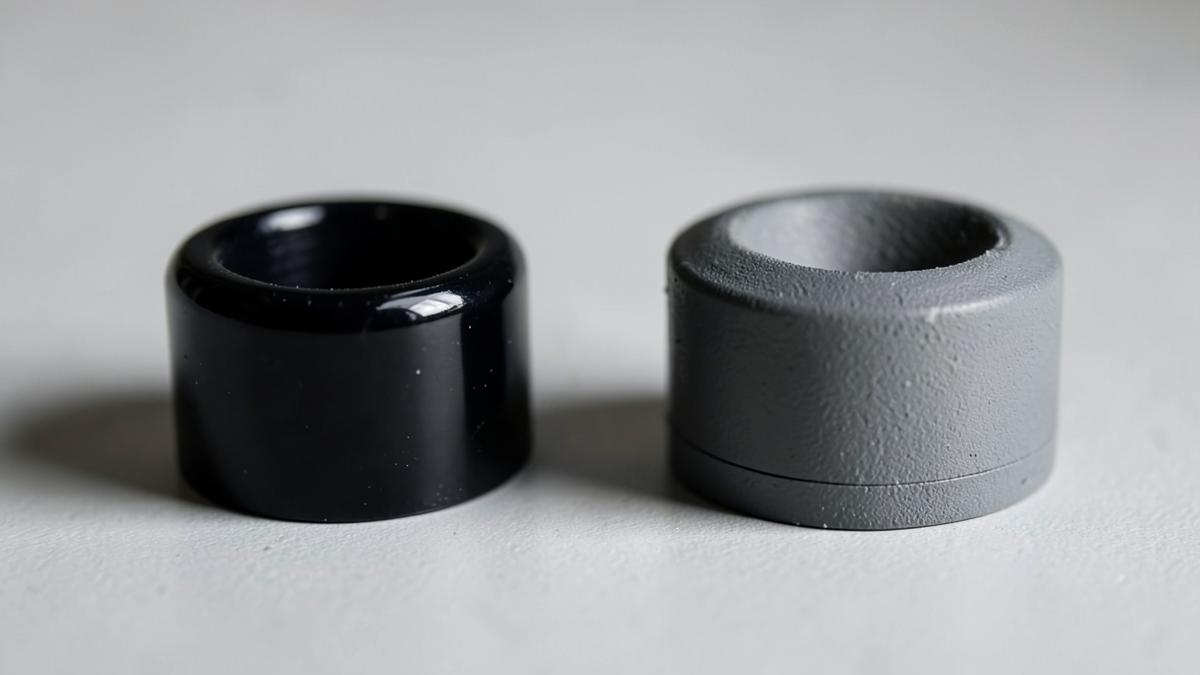
For example, a frosted glass bottle often appears more premium and eco-friendlier than a glossy plastic one, even if both contain the same product.
These sense cues work as shortcuts and set expectations:
• Visual appeal → shape, color, and finish set first views
• Tactile feel → weight, texture, and materials show strength
• Sound cues → soft noises, like a shut lid, show build quality
Cognitive Biases and Decision-Making
- Early Judgments Beyond the Label.
Buyers often form views before they read facts. The setting helps shape these ideas. A product in a posh shop looks better than the same item in a cheap store.
While rapid judgment helps people make decisions efficiently, it also increases vulnerability to misleading cues. Design and marketing can mask poor durability or environmental impact, distorting Perceived Quality.
Perceived quality shows physical traits and what they mean to buyers. Brand stories, price, and culture shape these views. This matters for green goods, where looks often replace deep checks.
Products that look sustainable – natural textures, muted colors, minimalist design – often lead consumers to assume genuine sustainability, even when that assumption is incorrect.
- Mental Shortcuts in Buying Decisions.
Consumers simplify decisions using heuristics, such as:
• Trusting brand reputation
• Associating higher prices with better quality
• Responding to repeated marketing exposure
As a result, people see high prices as a sign of better skill. This happens even if there is no proof. This hurts green goods that lack high prices or big ads.

Common views include:
• High price → signals better parts and rare style
• Rich packs → shows care and brand status
• Strong brand → shows trust and steady results
• Good design → shows new ideas and smart builds
The Role of Packaging and Design
Packaging and product design significantly influence Perceived Quality by communicating subtle but meaningful cues. Materials, construction, and visual presentation all contribute to these impressions.
For example, simple recyclable packaging often signals responsibility and thoughtful design, while excessive plastic layers may suggest wastefulness.
Design choices also communicate expected product lifespan:
• Durable, repairable designs imply longevity
• Fragile or sealed designs imply disposability
Consumers interpret these signals – often unconsciously – and form expectations accordingly. This link between design and perceived durability is crucial in shaping Perceived Quality in sustainable consumption.
Approaches to Perceived Quality in Product Development
Many views on quality have come up:
• Old shop methods often miss perceived quality
• Ads focus on how the buyer feels
• Heart-based builds focus on how a user feels
• Robust Design and Geometrically Robust Design fix looks
Figure 3. Visual robustness is a part of Appearance Conformance Quality (source –Diva-portal: FULLTEXT01
Despite these developments, researchers still lack a comprehensive engineering approach that integrates Perceived Quality, quantification, and design impact. This gap remains significant in both theory and practice.
Conclusion
Speaking of perceived quality, we are dealing with a complex, multifaceted adaptive system; a system where a human is the main agent. Therefore, as in any human adaptive system, single all-effective ‘causes’ cannot exist.
In this research, we justify the engineering viewpoint regarding perceived quality as an inevitable part of new product development.
Making a product with excellent perceived quality is not an extremely difficult task for a product development project today – almost anything related to superior quality can be achieved with increased cost and time investments.
The truly challenging task is to reach an optimal perceived quality level based on given boundaries regarding technologies, development time, production systems capabilities, and financial limitations. For that reason, perceived quality must be controlled during all stages of product development.
Subscribe
Dive deep into the dynamic world of new product development with LA NPDT Insights Blog.
Turning a feeling into a specification
People view quality as a matter of taste until you write it down. You can set targets for mass, shine, sound, and gap tolerances. Use standard tests for these metrics. Our table makes quality a clear rule rather than just a hunch.
Cue | What buyers infer | Specifiable parameter | Typical premium target | Test method |
|---|---|---|---|---|
Mass | Solidity, material value | Total mass and centre of gravity | Density above 1.4 g/cm3 at grip | Scale, CG fixture |
Surface texture | Care in manufacturing | Ra roughness, texture pattern | Ra 0.8-1.6 um soft-touch | Profilometer |
Gloss | Finish consistency | Gloss units at 60 degrees | 5-15 GU matte, 85+ GU high gloss | Glossmeter |
Gaps and flush | Assembly precision | Gap width and step | Gap 0.3 mm +/-0.1, step under 0.1 mm | Feeler gauge, CMM |
Sound | Mechanism quality | Peak frequency and duration | Under 250 ms, low-frequency thunk | Anechoic recording, FFT |
Actuation force | Deliberate engineering | Force-displacement curve | Crisp snap ratio above 45% | Force gauge |
Thermal feel | Material authenticity | Thermal effusivity | Metal or glass contact surface | Contact probe |
Weight: why heavier reads as better
Weight is the strongest single cue in handheld products because it is the first one the body registers. Buyers infer density from heft and material value from density. The effect is not linear — beyond a threshold, extra mass reads as clumsy rather than solid — and placement matters as much as total mass.
Product | Light version | Perceived-premium target | Common technique |
|---|---|---|---|
Remote control | 95 g | 150-180 g | Zinc insert behind battery bay |
Cosmetic compact | 28 g | 55-70 g | Zamak base, weighted lid |
Kitchen tool handle | 70 g | 130-160 g | Stainless core in polymer |
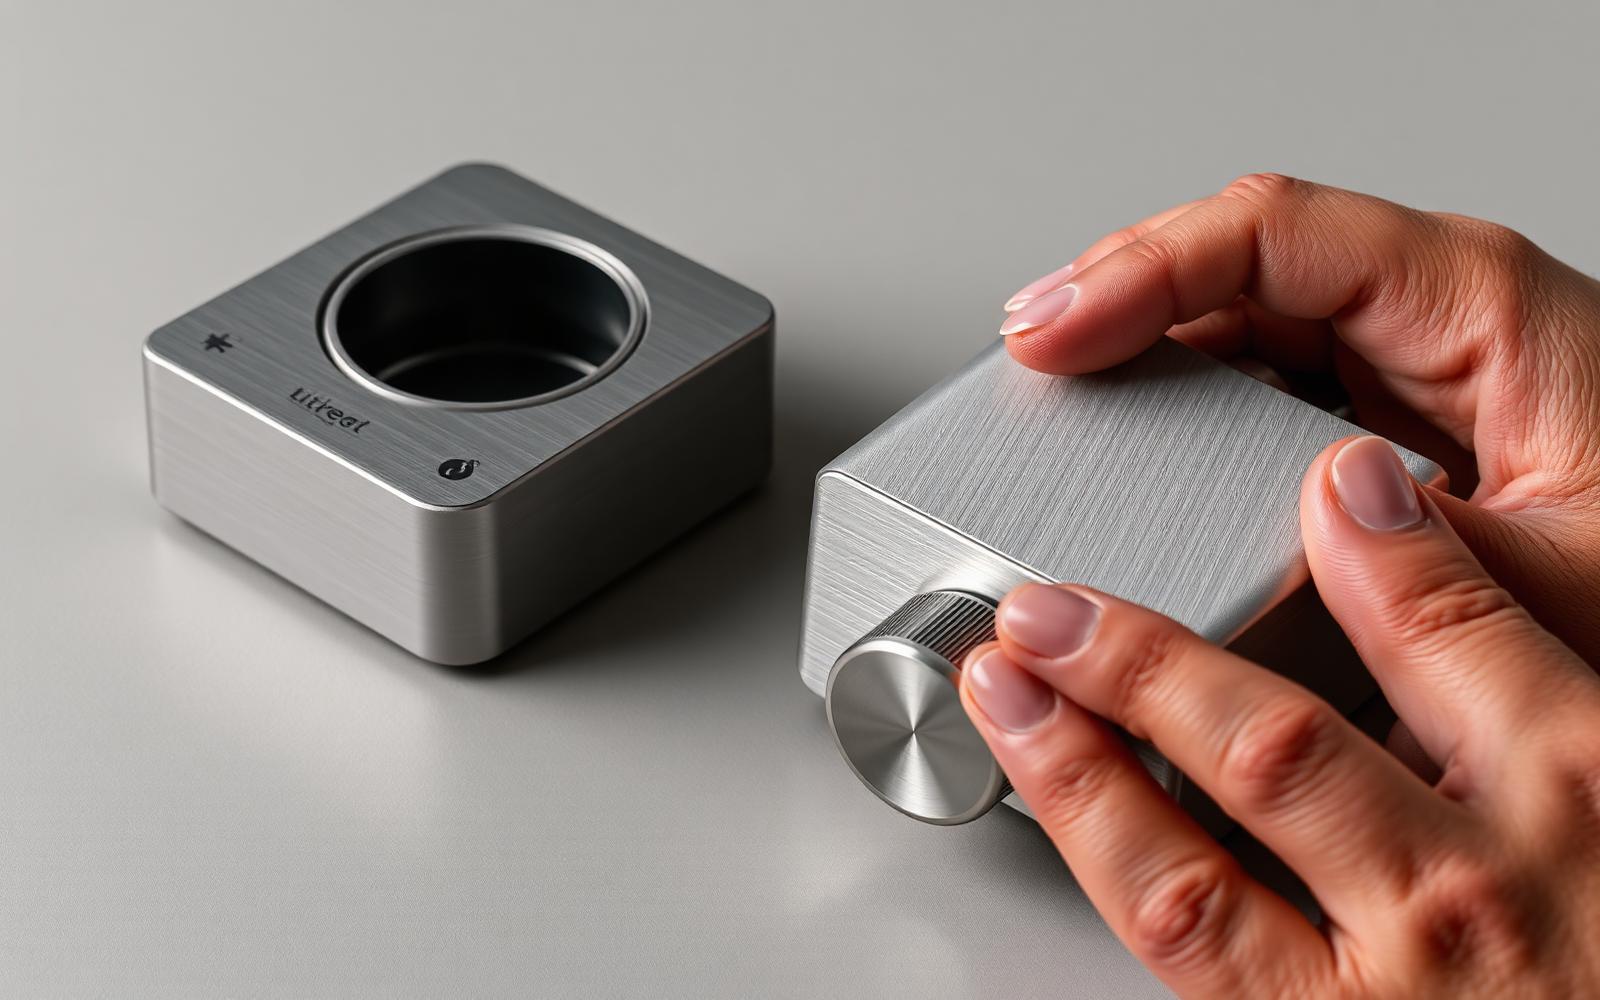
Audio knob | 6 g | 18-25 g | Machined aluminium cap |
Door of an enclosure | n/a | Damped close, no rebound | Counterweight plus soft-close hinge |
Place added mass low and toward the palm. The same 40 g added at the top of a handheld product reads as top-heavy and cheap; added at the base it reads as planted and considered.
Texture and finish
Texture shows both grip and care in making parts. Uniformity matters more than any specific texture. One visible sink mark or poor parting line ruins an expensive finish.
Finish | Perception | Cost adder per part | Risk |
|---|---|---|---|
Standard tool polish | Neutral, generic | Baseline | Shows flow lines |
MT-11010 light texture | Considered, matte | $0.02-$0.06 | Hides less than expected |
Soft-touch coating | Premium, warm | $0.35-$1.20 | Degrades with oils over 2-3 years |
Anodised aluminium | Precision, durable | $1.50-$6.00 | Colour matching between batches |
Physical vapour deposition | Jewellery-grade | $3-$12 | Lead time and minimum order |
In-mould decoration | Seamless graphics | $0.40-$1.10 | Tooling complexity |
Sound as a designed output
Every mechanism makes a sound and most teams leave it to chance. Buyers read a high, ringing click as flimsy and a short, low thunk as solid. Record candidates in a quiet room, run an FFT, and specify the target the same way you specify a force.
Sound event | Cheap signature | Premium signature | Design lever |
|---|---|---|---|
Button press | High click above 4 kHz | Muted click 1-2 kHz | Dome shape, cavity damping |
Lid close | Rattling multi-impact | Single 120 ms thunk | Damper, gasket, mass |
Rotary dial | Uneven scratchy detents | Even detents, low tick | Detent geometry, grease spec |
Enclosure tap | Hollow ring | Dead, dull tap | Ribbing, foam, wall thickness |
Motor run | Whine with tonal peak | Broadband low hum | Bearing choice, isolation mounts |
What each improvement costs
Perceived quality is one of the cheapest levers in hardware because most of the gains cost cents at volume. Rank candidates by perceived gain per dollar before spending on materials.
Improvement | Unit cost adder | Tooling adder | Perceived gain |
|---|---|---|---|
Tighten gap tolerance to 0.3 mm | $0.00 | $1,500-$4,000 | High |
Add 45 g steel counterweight | $0.28 | $0 | High |
Damping foam behind panel | $0.09 | $0 | Medium-high |
Texture the tool surface | $0.04 | $900 | Medium |
Soft-touch coating | $0.65 | $0 | Medium, degrades over time |
Machined metal accent | $2.40 | $0 | High on the touched surface only |
A three-second review protocol
- Hand the product to a first-time user and record the first three seconds on video.
- Ask for a price guess before any explanation of features.
- Score each sensory channel separately — sight, touch, sound, thermal — so weak channels are visible.
- Compare against two competitor products in the same blind session.
- Test the finish after simulated wear: 500 abrasion cycles and a hand-oil soak.
- Verify gap and flush on assembled units, not on CAD.
- Re-run the session after every cost-reduction change; savings frequently show up as a lower price guess.
Cheap signals to eliminate first
Signal | Why it reads cheap | Fix |
|---|---|---|
Visible sink marks | Implies uncontrolled process | Rib redesign, coring out thick sections |
Uneven panel gaps | Implies loose tolerances | Tighten the stack-up, add locating features |
Hollow tap sound | Implies empty and light | Internal ribbing and damping |
Sharp parting line | Implies unfinished tooling | Move the line to a shadowed edge |
Glossy plastic imitating metal | Reads as an imitation | Matte finish or real metal accent |
Loose battery door | Implies the whole product is loose | Over-centre latch with defined force |
Perceived quality is decided in the first seconds and paid for in cents. Our industrial design and product development teams set these targets as written requirements before tooling, when they are still free to change.
Frequently asked questions
What is perceived quality?
Perceived quality is a buyer's snap judgment about build and value. They use cues like weight, gloss, gaps, sound, and feel. This happens in three seconds before they read specs. It does not always match real reliability, so you can design it on its own.
How do you measure perceived quality?
Turn each cue into a clear metric. Measure mass, balance, Ra roughness, and gloss at 60 degrees. Track gaps in millimeters, sound frequency, and force curves. Then run blind tests against rivals and ask people to guess the price.
Why do heavier products feel higher quality?
Buyers use density as a proxy for material value, and heft is the first property the hand registers. The effect has limits: past roughly double the expected mass for the category, weight reads as clumsy. Placement matters too — mass low and toward the palm reads as planted, mass high reads as cheap.
What is the cheapest way to improve perceived quality?
Tighten gap and flush tolerances and remove cheap signals such as sink marks and sharp parting lines. Both cost little or nothing per unit and are the differences buyers notice first. Adding a small counterweight and damping foam are the next best value at a few cents per unit.
How does sound affect perceived quality?
A high, ringing click above 4 kHz reads as flimsy; a short, low thunk between 1 and 2 kHz reads as solid. Sound can be tuned through dome geometry, damping material, wall thickness, and internal ribbing, and should be specified with a target frequency and decay time like any other requirement.
Is perceived quality the same as actual quality?
No. Real quality means the part lasts and meets specs. Perceived quality is what a user feels. Products can score well on one but poorly on the other. Both matter. Perception drives sales, while real quality stops returns and wins reviews. Engineering perceived quality on purpose Perceived quality is measurable. Each sensory cue maps to a specification you can hold a supplier to.
Filed under:EducationUncategorized
Tagged:2025
Services related to this guide
- Product design servicesIndustrial design and CAD taken all the way to manufacturable files.
- Rapid prototypingWorking prototypes in days, from 3D printing to vacuum casting.
- Electronic design servicesSchematic, PCB layout, firmware and bring-up, through to production handoff.
- Product development examplesReal projects we designed, prototyped and shipped.