Tolerance stack-up example: worst case vs RSS on a prototype enclosure
A board, a tall part, and a 3D printed lid. Here is how we check that they fit before anyone prints, step by step, with real process tolerances and the math shown.
November 14, 20269 min read

Written by Konstantin Dolgan, Ph.D., NPDP
Founder & CEO, Product Development Engineer
Published November 14, 2026

What is a tolerance stack-up?
A tolerance stack-up is a calculation that combines the dimensions and tolerances of every feature in a chain to predict the smallest and largest value of one functional result: a gap, a clearance, an interference, or an alignment. ASME Y14.5 is the standard most US drawings use to state those tolerances, and it frames dimensioning and tolerancing as the way a drawing communicates fit, form, and function (ASME Y14.5).
In a prototype program, a stack-up answers a practical question before you spend money on parts: if every part comes in anywhere inside its tolerance, will the assembly still go together and work?
The example: a PCB and a tall part under a 3D printed lid
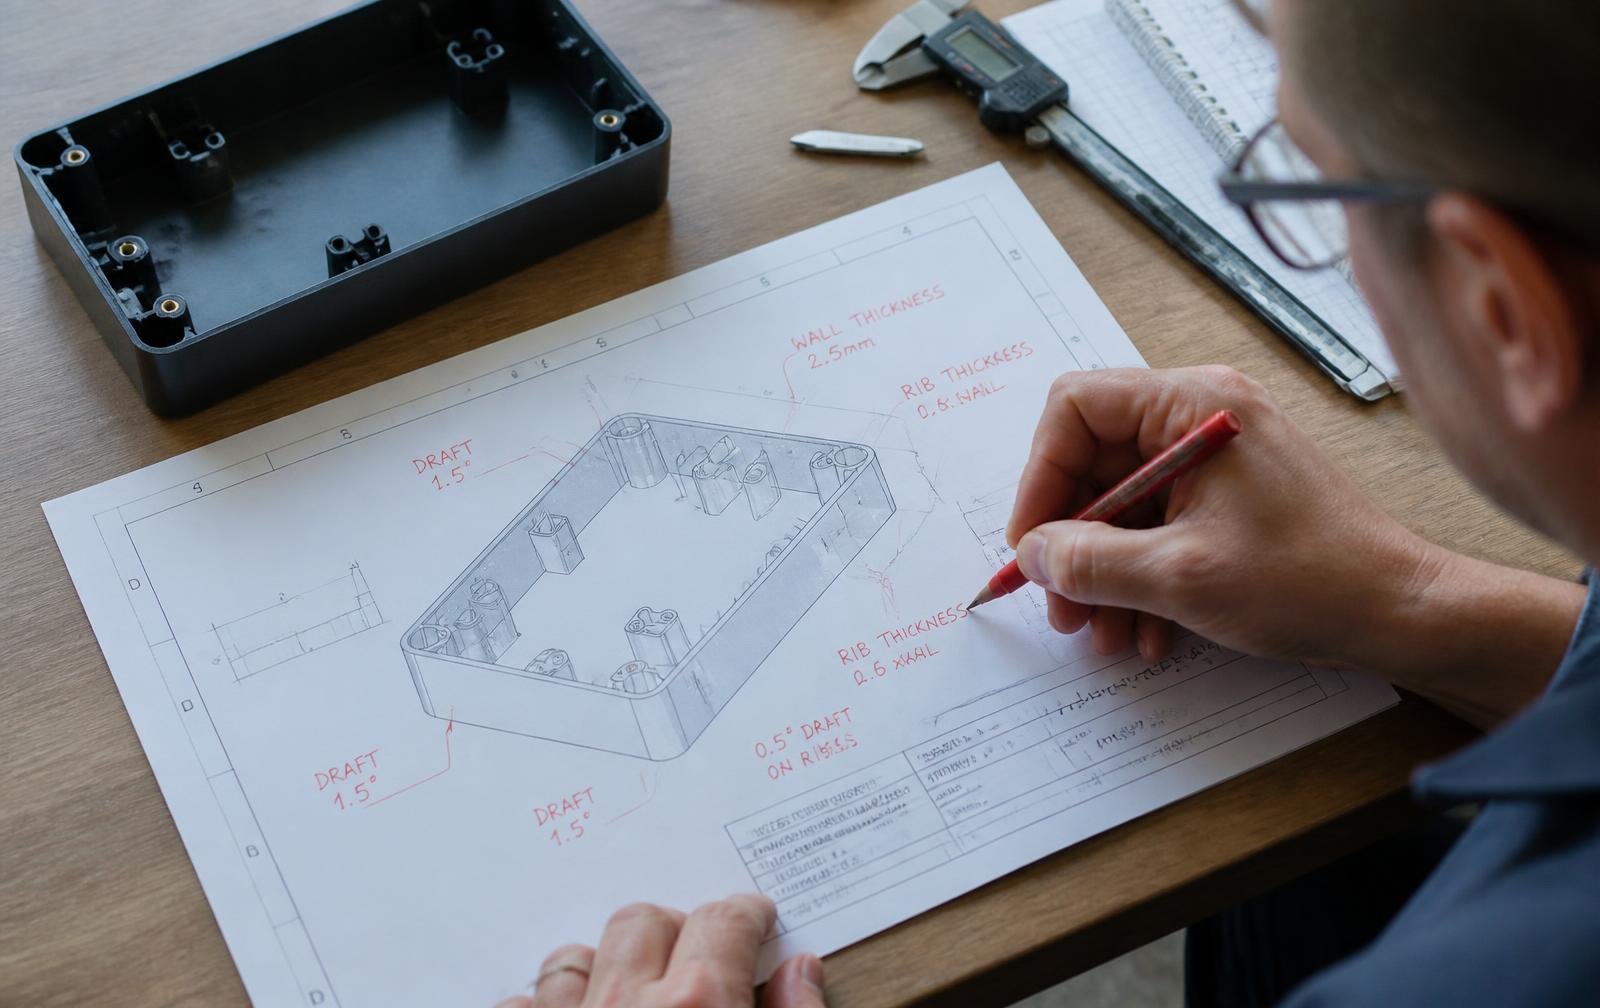
A common electromechanical prototype: a circuit board sits on bosses inside a 3D printed base, and a lid closes over it. The tallest part on the board, for example a connector or a capacitor, must not touch the lid. We want at least 0.30 mm of clearance so the lid does not press on the part when the product flexes or is dropped.
The numbers below are illustrative, chosen to show the method. Process tolerances are taken from published sources:
- 3D printed base and lid in prototyping-grade SLA: Protolabs Network lists dimensional accuracy for prototyping SLA/DLP of ±0.3% with a lower limit of ±0.3 mm, and for industrial SLA ±0.2% with a lower limit of ±0.13 mm (Protolabs Network manufacturing standards). At these sizes the lower limit applies.
- PCB thickness: board houses commonly state ±10% for boards 1.0 mm and thicker, for example 1.44 to 1.76 mm for a 1.6 mm board (NextPCB capabilities).
- Component height: from the part's datasheet. In this example, 12.50 ±0.20 mm.
Step 1: draw the loop and define the gap
Start at one surface of the gap and walk through every part until you arrive at the other surface. Each dimension you pass is a link. Dimensions that open the gap are positive; dimensions that close it are negative.
Our first version of the drawing dimensions the base from its floor:
Link | Dimension | Nominal (mm) | Tolerance (mm) | Direction |
|---|---|---|---|---|
A | Base: floor to rim | 14.00 | ±0.30 | + |
B | Lid: rim to inside ceiling | 6.00 | ±0.30 | + |
C | Base: floor to top of boss | 5.00 | ±0.30 | - |
D | PCB thickness | 1.60 | ±0.16 | - |
E | Component height above board | 12.50 | ±0.20 | - |
Nominal gap = 14.00 + 6.00 - 5.00 - 1.60 - 12.50 = 0.90 mm.
Step 2: worst case
Worst case assumes every part is at its limit at the same time, so the tolerances add directly. PTC's Creo documentation describes it as predicting the absolute upper and lower limits that all acceptable parts can produce (PTC Creo, types of stack-up analyses).
Worst case tolerance = 0.30 + 0.30 + 0.30 + 0.16 + 0.20 = ±1.26 mm
Gap range = 0.90 ± 1.26 = -0.36 to 2.16 mm. A negative gap is an interference: in the worst combination, the lid hits the part.
Step 3: RSS (root sum of squares)
RSS treats each dimension as a random, independent variation and combines them statistically:
RSS tolerance = √(0.30² + 0.30² + 0.30² + 0.16² + 0.20²) = ±0.58 mm
Gap range = 0.90 ± 0.58 = 0.32 to 1.48 mm. That passes the 0.30 mm requirement, barely.
So which answer is right? It depends on whether RSS's assumptions are true.
The classic RSS method assumes each dimension is normally distributed, centered in its tolerance band, with the tolerance equal to three standard deviations, and that dimensions vary independently (Scholz, University of Washington, Tolerance Stack Analysis Methods).
Scholz also notes that practice has shown the results are usually not quite as good as advertised.
Tolerance analysis vendors make the related point that RSS also assumes linear geometry, and that non-linear cases such as cams suit Monte Carlo simulation better (Enventive on worst case, RSS, and Monte Carlo).
Why prototypes change the method
Statistics need volume. When you build three or five prototypes, any combination of parts can show up, and the base and lid may come off the same print job with correlated errors. That breaks the independence and centering assumptions RSS relies on.
Our default: use worst case for prototype builds, and use RSS (or Monte Carlo) when planning production, where real process data exists and you can state the assumptions next to the result. If a prototype stack only passes under RSS, treat it as a risk to test, not as a pass.
Step 4: three ways to fix a failing stack
The worst case result above fails. Here are the levers, using the same example.
1. Fewer links: dimension to the function. Links A and C both start at the floor of the base, but the gap does not care where the floor is. Dimension the base from the rim straight to the top of the boss instead (9.00 ±0.30) and the chain drops from five links to four.
Worst case tolerance = 0.30 + 0.30 + 0.16 + 0.20 = ±0.96 mm, so the gap range becomes -0.06 to 1.86 mm. Much better, still a slight interference.
2. Tighter process on the links that matter. Moving the base and lid from prototyping-grade SLA (±0.30 mm) to industrial SLA (±0.13 mm at this size, per the Protolabs Network standard above) gives:
Worst case tolerance = 0.13 + 0.13 + 0.16 + 0.20 = ±0.62 mm, gap range 0.28 to 1.52 mm. Close, but still under the 0.30 mm target. Notice that the PCB and the component now drive most of the stack, and you cannot print your way out of those.
3. Shift the nominal. With the four-link chain and the original print process, raise the lid's inside ceiling by 0.40 mm (lid link 6.40 ±0.30). Nominal gap becomes 1.30 mm and the worst case range is 0.34 to 2.26 mm. It passes, and it costs nothing in process.
Option | Links | Worst case range (mm) | Meets ≥0.30 mm? |
|---|---|---|---|
Original drawing | 5 | -0.36 to 2.16 | No |
Dimension rim to boss | 4 | -0.06 to 1.86 | No |
Plus industrial SLA | 4 | 0.28 to 1.52 | No (close) |
Rim to boss, lid +0.40 mm | 4 | 0.34 to 2.26 | Yes |
In a real program you check the side effects of each fix before choosing: a taller lid changes the product's overall height and may move a button or a display window, so the stack-up goes into the design review with those trade-offs visible.
Prototype tolerances are not production tolerances
A stack that works on 3D printed parts has to be redone for the production process. Published 3D printing tolerances vary widely by technology and grade: the same Protolabs Network standard lists prototyping FDM at ±0.5% with a ±0.5 mm lower limit, while Protolabs lists SLA at ±0.002 in.
(±0.0508 mm) in X and Y for the first inch plus 0.1% of nominal, and ±0.005 in. (±0.127 mm) in Z for the first inch plus 0.1% of nominal height (Protolabs, 3D printing tolerances). Build orientation matters too, because Z tolerances are often looser than X and Y.
When the part moves to injection molding, tolerances, shrink, and draft all change, and tighter tolerances drive tooling cost. Our guide to injection molding cost and what drives tooling covers that side, and soft tooling vs hard tooling covers the bridge between printed and molded parts.
Can AI do a tolerance stack-up analysis?
AI tools can speed up the slow parts of a stack-up, mainly finding the dimensions and building the chain, but an engineer still has to confirm that the chain is the right one and that the inputs are real.
What vendors say their tools do (treat these as vendor claims): bananaz describes building stack-ups from the dimensions and GD&T already on your drawings and computing worst case and RSS automatically (bananaz tolerance analysis).
RD8 describes automatically detecting tolerance chains between two selected parts from a STEP file and running RSS, worst case, or Monte Carlo (RD8 automatic stack-up detection).
TolFlow, built for Onshape, says it pulls dimensions and GD&T from structured drawing data rather than relying on LLM guesswork (TolFlow).
That last point is the one we agree with most: let software extract and calculate deterministically, and do not let a chat model do the arithmetic from memory.
Where we find AI useful on a stack-up:
- Listing every dimension that touches a critical gap, so nothing in the chain is missed
- Pulling component heights and board thickness tolerances from datasheets and fab specs
- Re-running the stack automatically when a CAD revision changes a link
- Drafting the review note that explains the result and the assumptions
Where a human still decides:
- Which gaps are critical in the first place, and what the minimum clearance really needs to be
- Whether RSS assumptions are valid for this quantity and process
- Which fix is acceptable once its side effects on the product are known
- Whether a tool's chain matches how the parts actually locate against each other
For our broader view of AI in CAD work, see AI CAD agents for prototyping in 2026.
Tolerance stack-up analysis: a short method you can reuse
- Name the gap and its requirement (minimum, maximum, or both) and why it matters.
- Draw the loop from one surface of the gap to the other; list every link with its sign.
- Use real tolerances: the process you will actually use for each part, and datasheet or fab values for bought parts.
- Run worst case. For prototypes, this is the result you build to.
- Run RSS or Monte Carlo only with written assumptions, and only where you have volume or process data.
- If it fails, try fewer links first, then a shifted nominal, then tighter processes on the biggest contributors.
- Record the stack, the result, and the decision in the design review, and redo it when the process or a link changes.
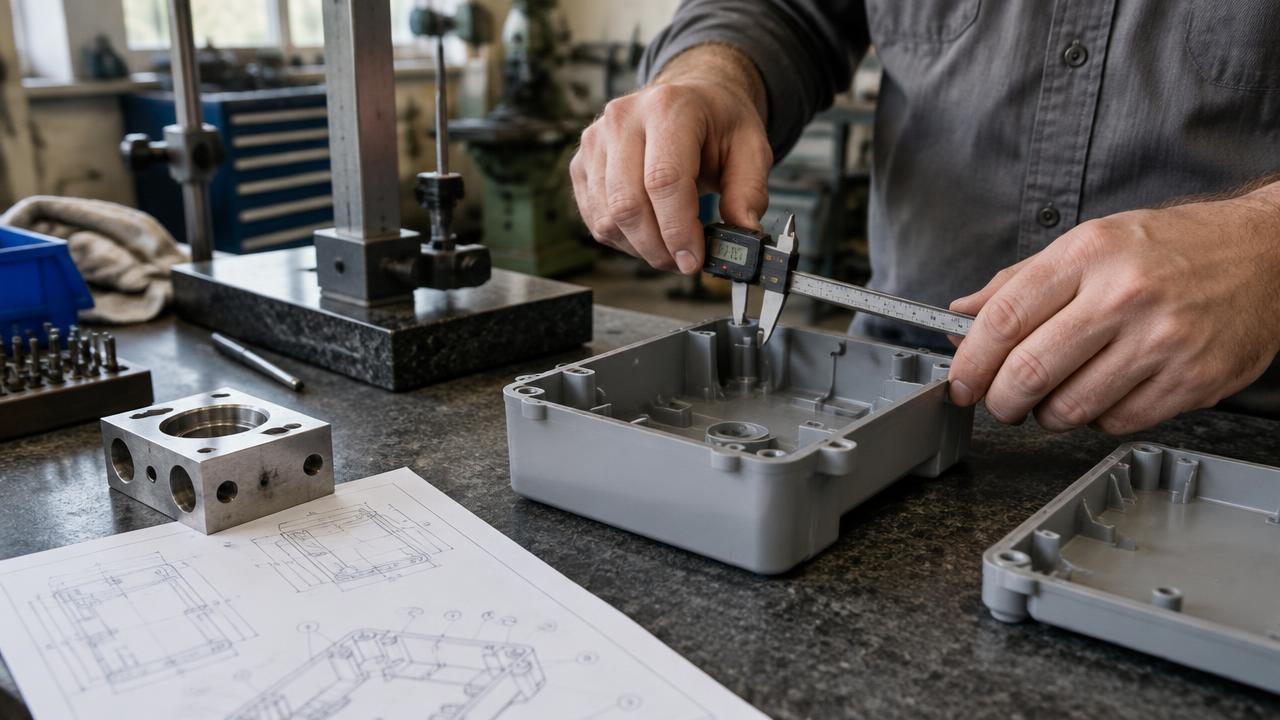
- Measure the first prototypes against the predicted range. Our first article inspection checklist shows how to check parts against the drawing.
How LA NPDT handles tolerance stack-ups in prototype programs
At LA NPDT, mechanical design, electronics, and prototyping sit in the same team, so the board, the parts on it, and the enclosure are checked together rather than in separate files. In practice:
- Critical gaps are identified in the engineering design review and the PCB design review placement check, using the enclosure model
- Stack-ups use the tolerances of the process we will actually build with, which our in-house rapid prototyping team knows first-hand
- Prototype fits are checked worst case; production stacks are redone for the production process during design for manufacturing review
- Stack-up results feed the design freeze decision before tooling
- AI tools help find and update chains; every result is checked by an engineer
If you have a design that needs to fit together, or an idea that needs a design, start with a free 20-minute call: book here. When a project needs a deeper look before any build, our Stage 1 Review/Analysis + Plan is a fixed $800 single payment. For enclosure-specific checks, see our enclosure design for electronics checklist.
Want an engineer to check your stack-ups before you print?
If you have a design that needs to fit together, or an idea that needs a design, book a free 20-minute call. When a project needs a deeper look before any build, Stage 1 Review/Analysis + Plan is a fixed $800 single payment. Phone: +1 318-200-0526.
Sources
Frequently asked questions
What is a tolerance stack-up example?
A tolerance stack-up example walks through a real chain of parts, such as a PCB on bosses under a lid, adds each dimension and tolerance in the chain, and shows the minimum and maximum value of the gap that matters, using worst case and often RSS.
What is the difference between worst case and RSS tolerance analysis?
Worst case adds every tolerance at its limit and guarantees the range for all in-tolerance parts. RSS combines tolerances as the square root of the sum of their squares, assuming independent, centered, normally distributed variation, so it predicts a tighter range that most, but not all, assemblies will fall within.
When should you use worst case instead of RSS?
Use worst case when quantities are small, as with prototypes, when parts may share correlated errors, when a failure is unacceptable, or when you do not have process data. RSS is better suited to production volumes with stable, measured processes.
How many links should a tolerance stack-up have?
As few as possible. Each link adds variation, so dimensioning drawings to the function, for example from a mating surface straight to a feature, is often the cheapest way to make a stack pass.
What tolerances should I use for 3D printed prototype parts?
Use the published tolerance for the specific process and grade you will print with, and check build orientation. Protolabs Network, for example, lists prototyping SLA at ±0.3% with a ±0.3 mm lower limit and prototyping FDM at ±0.5% with a ±0.5 mm lower limit.
Can AI do a tolerance stack-up?
AI-assisted tools can extract dimensions from drawings or CAD, build tolerance chains, and run worst case, RSS, or Monte Carlo calculations. An engineer still needs to confirm the chain, the inputs, the assumptions, and the fix.
Services related to this guide
- 3D modeling servicesParametric CAD, renders and print-ready files built for manufacturing.
- Best industrial design firmsWhich studios take an idea from form to manufacturable hardware, and what they charge.
- Product design servicesIndustrial design and CAD taken all the way to manufacturable files.
- Product development examplesReal projects we designed, prototyped and shipped.