
U.S. Battery Energy Storage Systems (BESS) Market Trends (2026–2030)
A free, startup-usable snapshot of U.S. stationary battery energy storage (grid and behind-the-meter hardware): capacity, revenue estimates, growth drivers, segments, risks, and where product teams can still invent.
September 5, 20267 min read

Written by Konstantin Dolgan, Ph.D., NPDP
Founder & CEO, Product Development Engineer
Published September 5, 2026
A startup-usable snapshot of stationary storage
- ~52 GW
- U.S. utility-scale battery storage installed by mid-2026
- EIA
- ~$7.5B to ~$14.9B
- U.S. BESS market value, 2025 to 2030, at roughly 14.9% CAGR
- MarketsandMarkets
- 19 to 28 GW
- 2025 deployment estimates conflict by source; quote a range
- Wood Mackenzie vs Benchmark/SEIA
This report covers stationary battery energy storage systems (BESS): utility-scale plants, commercial and industrial (C&I) installations, and residential systems. It does not cover EV traction batteries. It is written for inventors, hardware startups, and product teams deciding where to build next.
In one line: U.S. utility-scale storage reached roughly 52 GW by mid-2026 (EIA), and the U.S. BESS market was worth about $7.5 billion in 2025 on its way to about $14.9 billion by 2030 at roughly 14.9% CAGR (MarketsandMarkets).
Every figure below is traceable to a named source in the Sources section. Where monitors disagree, we show the range and say so. Browse all of our free reports on the Market Reports index.
Market Size and Growth
Installed capacity (government data)
The U.S. Energy Information Administration reports that utility-scale battery storage reached 43.6 GW of operational nameplate capacity by the end of 2025. Operators added another 8.3 GW in the first half of 2026, bringing the total to nearly 52 GW. Average annual growth over the prior three years was about 70% (EIA, Today in Energy).
Operators report plans for about 54 GW more through 2028: roughly 14 GW in the remainder of 2026, 26 GW in 2027, and 14 GW in 2028 (EIA).
Annual installations (trade monitors, and they conflict)
- Wood Mackenzie (via Utility Dive, March 2026): a record 18.9 GW / 51 GWh installed in 2025, up 52% in GW and 40% in GWh versus 2024. Utility-scale alone was 16 GW / 47.3 GWh.
- Benchmark Mineral Intelligence for SEIA (via Utility Dive): 2025 deployments jumped 29% to exceed 28 GW / 57 GWh, with 16 GW / 50 GWh utility-scale. Cumulative energy at end-2025: about 137 GWh utility-scale, 19 GWh C&I, and 9 GWh residential. Benchmark expects more than 600 GWh on the U.S. grid by 2030.
Note the disagreement. The Wood Mackenzie and Benchmark/SEIA annual GW figures for 2025 do not match (about 19 GW versus about 28 GW). The difference comes down to methodology and which segments each monitor counts. For installed utility-scale capacity stock, prefer the EIA numbers above. Treat annual deployment figures as a range, roughly 19 to 28 GW for 2025, depending on the source.
Revenue size (named market report)
MarketsandMarkets values the U.S. BESS market at about $7.46 billion in 2025, projected to reach about $14.93 billion by 2030, a CAGR of roughly 14.9% over 2025 to 2030 (MarketsandMarkets, U.S. BESS market).
Forward capacity views
Wood Mackenzie projects cumulative U.S. energy storage could reach about 200 GW / 655 GWh by 2031 (via Energy-storage: us double bess capacity eia reports). The same house forecasts roughly 16% annual growth in utility-scale installations through 2031, and about 500 GW of additions across all segments in that outlook window (via Utility Dive).
Growth Drivers
- Renewable integration. Solar-plus-storage hybrids keep expanding, and the EIA notes that solar plants host the largest storage units.
- Grid reliability and economics. Peak shaving and wholesale price arbitrage give storage a revenue case independent of policy.
- Policy support. Tax credit support for standalone storage (the ITC) was preserved even as other clean-energy rules shifted. The new FEOC eligibility rules add real complexity, covered under risks below.
- Data centers and large loads. Fast, flexible capacity is in demand. Benchmark notes data centers could dominate behind-the-meter C&I storage by 2030.
- Battery cost history. Cell costs have declined for years, although system pricing rose in parts of 2025 amid tariffs. Wood Mackenzie noted a roughly 23% system price increase from Q4 2024 to Q4 2025.
- Geographic diversification. 22 states installed utility-scale storage in 2025 (Wood Mackenzie via Utility Dive), so this is no longer a two-state market.
Key Segments
By customer: utility-scale is dominant. C&I and community storage sit in the middle. Residential surged into the 2025 credit deadlines, and Benchmark expects residential may soften after the Section 25D expiration.
By chemistry: lithium-ion dominates. Flow batteries and other long-duration chemistries remain an innovation niche rather than the volume business.
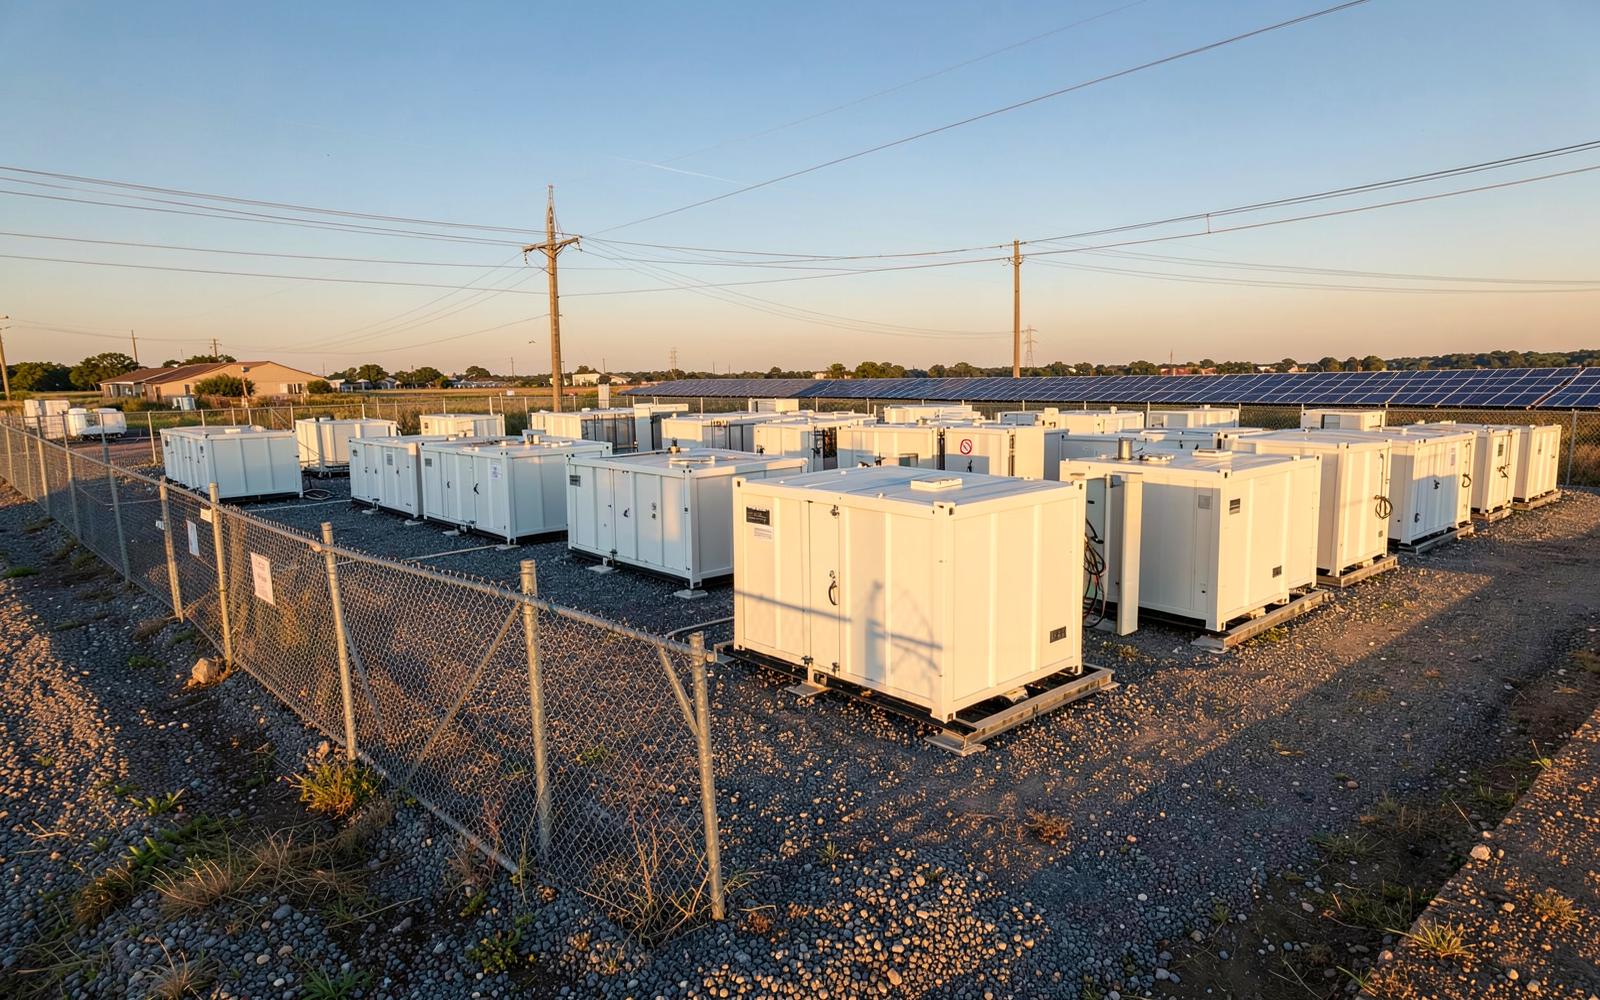
By hardware stack: cells and modules, racks, power conversion systems (PCS) and inverters, battery management systems (BMS), thermal management, fire detection and suppression, outdoor enclosures and containers, transformers and switchgear, and EMS/controls software.
Most of the stack is mechanical, electrical, and software engineering, which is where smaller product companies can realistically enter.
Teams scoping BMS, sensing, or enclosure hardware often pair electronic product development with industrial product design before freezing interfaces.
Where Startups Are Building
The opportunity categories below keep showing up in procurement documents, code conversations, and pilot programs. They are product categories, not a ranked company list. If you are still choosing which gap to own, product discovery turns this market map into a requirements brief.
- Outdoor enclosures and containerized systems designed around AHJ and fire-code spacing requirements
- Thermal management and thermal runaway containment
- Gas detection, early smoke and thermal imaging detection, and deflagration venting
- Interconnection-friendly skids and balance-of-system packaging
- BMS and sensing for cell-to-pack health monitoring
- EMS, controls, and virtual power plant software for residential and C&I fleets
- Domestic-content and FEOC-compliant supply-chain packaging and labeling tools
U.S. manufacturing capacity for modules and systems is scaling: the Energy Storage Coalition (via Utility Dive) puts it at about 69 GWh at the end of 2025, heading toward roughly 164 GWh by the end of 2027. Usable FEOC-compliant supply may lag the headline capacity, which matters for anyone specifying hardware today. Early low-volume manufacturing planning helps you see which domestic and compliant sources are actually quotable for a pilot.
Risks and Constraints
- Fire codes. NFPA 855 (2026 edition) and UL 9540A (6th edition, published March 13, 2026) drive large-scale fire testing, spacing, detection, and suppression design. See the UL Solutions ESS installation codes FAQ and the NFPA 855 standard page.
- Interconnection queues and permitting timelines. Projects can wait years for studies and approvals, which shapes buying cycles for hardware.
- Tariffs and price spikes. System pricing rose about 23% from Q4 2024 to Q4 2025 (Wood Mackenzie via Utility Dive; also covered by Anza and Benchmark).
- FEOC rules. Material-assistance and foreign-entity restrictions under recent federal tax-credit changes complicate procurement and financing (Morgan Lewis analysis).
- Supply-chain reality. Usable domestic, FEOC-compliant supply trails headline manufacturing capacity.
- Forecast uncertainty. Wood Mackenzie high and low cases differ by roughly 52 GW through 2031, depending on FEOC guidance and load growth. Plan products, not just spreadsheets, around that spread. Product development consulting is a practical way to pressure-test a BESS hardware plan against code and sourcing risk before tooling.
From market size to a buildable product
Capacity and revenue figures only show that stationary storage is scaling. Turning this report into a shippable BESS product usually means walking a clear path: discovery and requirements, product design and industrial design, prototyping, then manufacturing readiness.
Product discovery and requirements. Pick a gap you can own (enclosures, thermal containment, detection, BOS packaging, BMS sensing, EMS/controls) and write requirements around AHJ approval, UL/NFPA evidence, service access, and install ergonomics. Product discovery and a rough market size estimate keep the thesis honest before CAD begins.
Product design and industrial design. Spacing geometry, thermal paths, detection interfaces, and maintainable enclosures belong in the first design review, not the last. Product design and industrial design lock the envelope that fire marshals and insurers will actually accept.
Prototyping. Build to answer code, thermal, and field-install questions, not only to look finished. Rapid prototyping and early budget checks with the prototype cost calculator keep iterations intentional. See also how much a prototype costs.
Manufacturing readiness. Once the design works, DFM, FEOC-aware sourcing, and short-run validation decide whether a pilot can scale. Low-volume manufacturing support is where BOM and compliance risk show up before you commit tooling.
- Safety and thermal design are product features, not afterthoughts. Enclosures, sensors, and suppression interfaces increasingly decide which products get permitted and insured.
- Design for code evidence early. UL 9540 and UL 9540A data packages, serviceability, and spacing geometry belong in the first design review, not the last.
- Balance-of-system and field-install ergonomics often decide bankability more than cell chemistry alone.
- Sensors, interconnect hardware, and maintainable enclosures are realistic entry points for small teams, compared with trying to compete on cells.
- BMS, detection, and controls work often need electronic product development alongside the mechanical enclosure stack.
If you want a second set of eyes on a BESS hardware thesis, book a consultation or apply to partner. Related pages: industrial product design and development, electronic product development, rapid prototyping, and product development consulting. A related snapshot is our EV charging market report.
Key Takeaways
- U.S. utility-scale storage is near 52 GW (mid-2026, EIA) and still compounding fast.
- Revenue should roughly double to about $14.9 billion by 2030 (MarketsandMarkets, ~14.9% CAGR).
- 2025 deployment numbers conflict by source (about 19 GW versus about 28 GW); quote a range.
- Fire codes (NFPA 855, UL 9540A) and FEOC rules are the binding constraints on hardware design and sourcing.
- The accessible opportunities for startups sit in enclosures, thermal, sensing, BOS packaging, and controls software.
- Budgeting an early build? Use the prototype cost calculator or book a consultation with an engineer.
Sources
- U.S. EIA, Today in Energy: Eia: detail
- Utility Dive, Wood Mackenzie and Energy Storage Coalition: Read more on Utilitydive
- Utility Dive, Benchmark Mineral Intelligence and SEIA: Read more on Utilitydive
- MarketsandMarkets, U.S. BESS market: Read more on Marketsandmarkets
- Energy-Storage.news, EIA and Wood Mackenzie cumulative outlook: Energy-storage: us double bess capacity eia reports
- UL Solutions, ESS installation codes FAQ: Ul: installation codes and requirements energy storage systems ess faqs
- Morgan Lewis, FEOC and storage tax credits: Morganlewis: how feoc rules are reshaping energy storage tax credit eligibility
- NFPA 855 (2026) standard page: Read more on Nfpa
Key metrics at a glance
Every figure below appears in the report above. Sources disagree on 2025 installations, so that row is a range, not a single value.
| Metric | Value | Year | Source |
|---|---|---|---|
| U.S. BESS market size | ~$7.46 billion | 2025 | MarketsandMarkets |
| U.S. BESS market size | ~$14.93 billion | 2030 | MarketsandMarkets |
| U.S. BESS market CAGR | ~14.9% | 2025-2030 | MarketsandMarkets |
| Utility-scale capacity stock | ~43.6 GW | End of 2025 | EIA |
| Utility-scale capacity stock | ~52 GW | Mid 2026 | EIA |
| Planned utility-scale additions | ~54 GW (about 14 / 26 / 14 GW) | Through 2028 | EIA |
| 2025 annual installations | ~18.9 to 28 GW (range) | 2025 | Wood Mackenzie vs Benchmark/SEIA |
| Cumulative energy by segment | ~137 / 19 / 9 GWh | End of 2025 | Benchmark/SEIA |
Table: Key U.S. BESS metrics, with the source behind each figure.
Cumulative storage energy by segment
End of 2025 cumulative energy capacity, in gigawatt-hours. Utility-scale projects account for the overwhelming share of installed energy.
- Utility-scale: ~137 GWh
- Commercial and industrial: ~19 GWh
- Residential: ~9 GWh
Source: Benchmark Mineral Intelligence and SEIA cumulative figures, end of 2025, via Utility Dive. Utility-scale ~137 GWh, commercial and industrial ~19 GWh, residential ~9 GWh.
Utility-scale capacity path
Operational utility-scale nameplate capacity in gigawatts, plus the pipeline developers have announced through 2028.
Source: EIA, Today in Energy. Planned additions split roughly 14 GW in the remainder of 2026, 26 GW in 2027 and 14 GW in 2028. Plans slip, so the pipeline bar is intent, not a guarantee.
Questions founders ask about the BESS market
What is the U.S. BESS market size?
MarketsandMarkets puts the U.S. battery energy storage market at roughly $7.46 billion in 2025 and projects it to reach about $14.93 billion by 2030. Utility-scale systems carry most of that value; commercial, industrial and residential segments are smaller but growing.
What is the U.S. BESS CAGR?
MarketsandMarkets projects a compound annual growth rate of about 14.9% from 2025 through 2030 for the U.S. market. On the physical side, the EIA reports utility-scale capacity grew at roughly 70% per year on average over the three years before its latest count, so dollar growth is slower than hardware deployment growth.
How much utility-scale battery storage capacity is installed in the U.S.?
The EIA counts about 43.6 GW of operational utility-scale nameplate capacity at the end of 2025. Another 8.3 GW came online in the first half of 2026, bringing the total to nearly 52 GW by mid-2026, with roughly 54 GW more planned through 2028.
Why do 2025 installation figures conflict between sources?
Wood Mackenzie tallied about 18.9 GW of U.S. storage installed in 2025, while Benchmark Mineral Intelligence and SEIA count closer to 28 GW. The gap comes from different segment coverage, commissioning-versus-announcement timing, and how partial-year projects are credited. Treat 2025 as a range of roughly 19 to 28 GW rather than a single number.
What are the main risks for hardware startups in BESS?
Fire codes are the gatekeeper: NFPA 855 compliance, thermal management and AHJ approval decide whether a system can be installed at all. Supply-side risk includes FEOC restrictions and domestic content rules under the ITC, which limit battery cell sourcing. And forecast uncertainty is real, as the wide 2025 installation range shows, so plan capacity and cash against a range, not a point.
Where can product teams enter the BESS value chain?
Building hardware for this market
If this research is the front end of a product decision, these are the parts of the work we handle in house.
- Power electronics and control boards
Schematic, layout, firmware and certification for battery and inverter hardware.
- Enclosures and industrial equipment
Cabinets, thermal paths and serviceable assemblies for field-installed systems.
- First production run
Bridge builds and pilot batches before you commit to hard tooling.
Cite this report
Using these figures in a pitch deck, grant application or internal memo? Cite it as:
LA New Product Development Team (LA NPDT). "U.S. Battery Energy Storage Systems (BESS) Market Trends (2026–2030)." 2026. https://lanpdt.com/us-battery-energy-storage-bess-market-trends-2025/
Every figure is attributed to its original source in the Sources list above. Please cite the original publisher for their own data.