
Lab Automation Equipment Market Trends (2026–2034)
Sourced snapshot of the laboratory automation equipment market: size and CAGR from Fortune Business Insights, MarketsandMarkets, and Grand View Research, plus segments, drivers, risks, and product-development angles for hardware teams.
September 18, 20265 min read

Written by Konstantin Dolgan, Ph.D., NPDP
Founder & CEO, Product Development Engineer
Published September 18, 2026
A startup-usable snapshot of the lab automation equipment market
- ~USD 9.2B to ~USD 20.71B
- Global laboratory automation, 2025 to 2034, at 9.43% CAGR
- Fortune Business Insights
- ~USD 6.26B / ~USD 6.60B to ~USD 8.62B
- Global lab automation, 2025/2026 to 2031, at 6.6% CAGR
- MarketsandMarkets
- ~USD 8.27B / ~USD 9.05B to ~USD 18.39B
- Global lab automation, 2024/2025 to 2033, at ~9.3% CAGR
- Grand View Research
This report covers laboratory automation equipment and closely related systems: automated workstations and liquid handlers, microplate readers, ELISA and nucleic acid purification systems, robotic arms and work cells, automated storage and retrieval, plus lab software often bundled into analyst totals (LIMS, ELN). It is written for inventors and product teams building physical lab tools, not for enterprise LIMS-only SaaS decks.
Scopes differ across firms. Fortune Business Insights and Grand View Research sit near the USD 9 billion band for 2025; MarketsandMarkets is lower at about USD 6.26 billion in 2025. Name the source every time. Do not average series.
In one line: Fortune Business Insights puts the global laboratory automation market at about USD 9.2 billion in 2025, about USD 10.07 billion in 2026, and about USD 20.71 billion by 2034 at a 9.43% CAGR.
MarketsandMarkets reports about USD 6.26 billion in 2025 and about USD 6.60 billion in 2026 toward about USD 8.62 billion by 2031 at a 6.6% CAGR, with automated workstations at about 40.2% of 2025 share.
Grand View Research reports about USD 8.27 billion in 2024 and about USD 9.05 billion in 2025 toward about USD 18.39 billion by 2033 at about 9.3% CAGR. Product openings we see: modular liquid handlers, compact purification and ELISA modules, and collaborative sample movers.
Every figure below is traceable to a named source in the Sources section. Where series disagree, we show the range and say so. Browse all of our free reports on the Market Reports index.
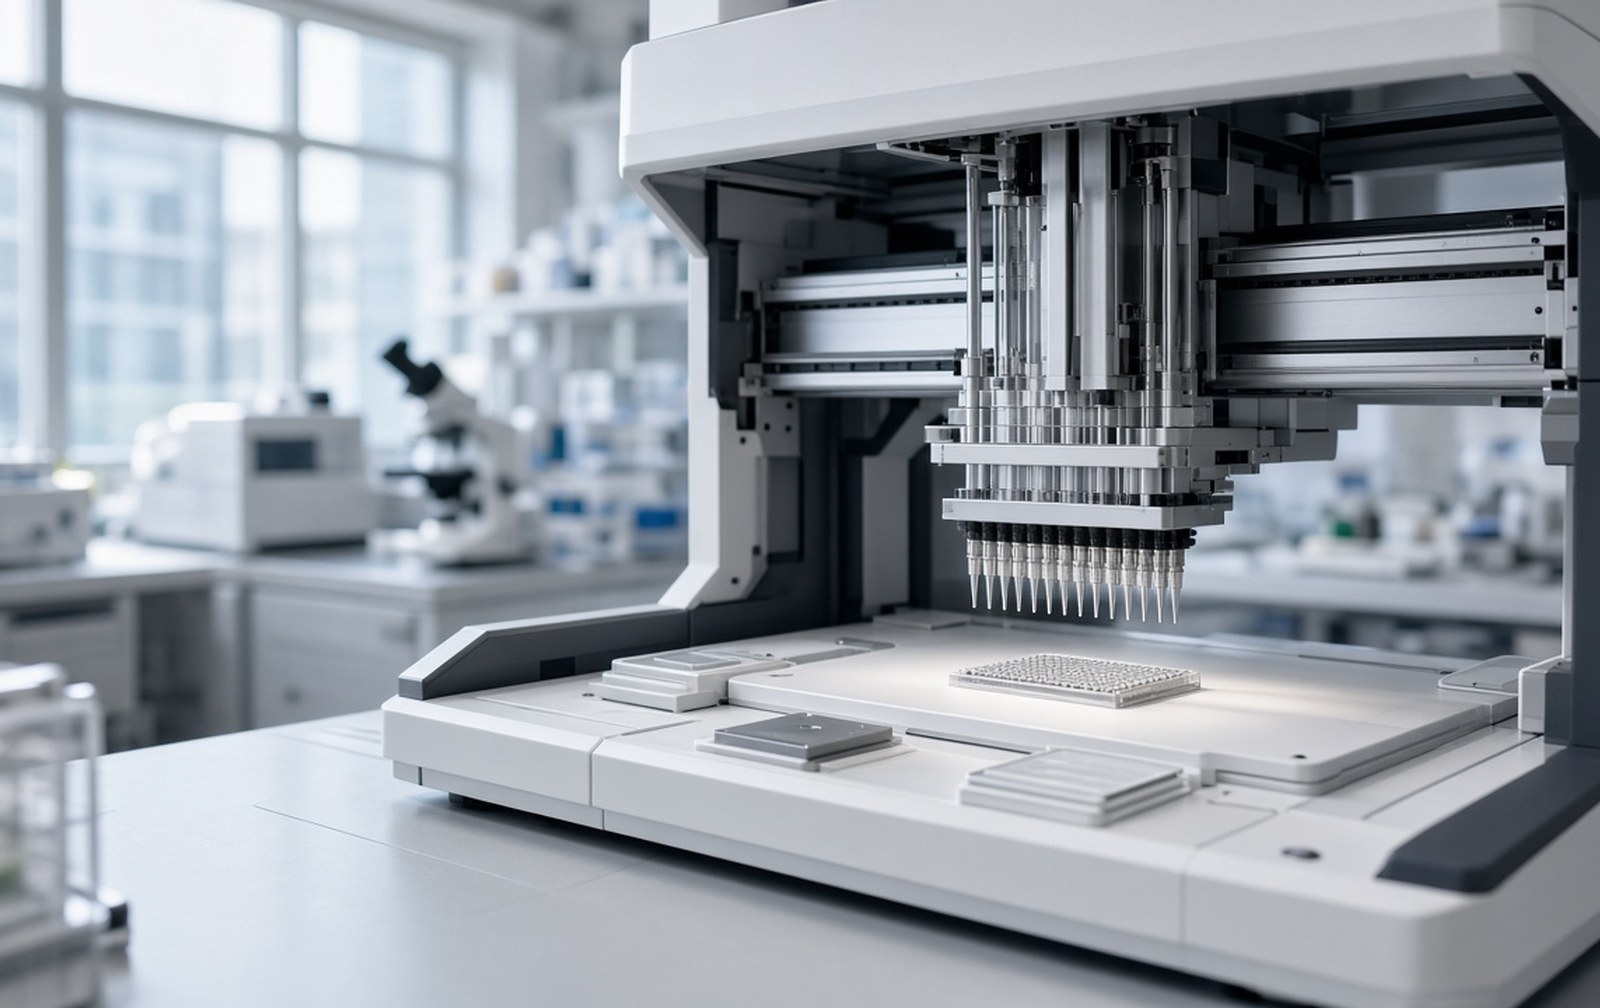
Market Size and Growth
Fortune Business Insights
- 2025: about USD 9.2 billion
- 2026: about USD 10.07 billion
- 2034: about USD 20.71 billion
- CAGR 2026-2034: 9.43%
MarketsandMarkets (May 2026 report)
- 2025: about USD 6.26 billion
- 2026: about USD 6.60 billion
- 2031: about USD 8.62 billion
- CAGR 2026-2031: 6.6%
- Automated workstations: largest product share at 40.2% in 2025
- Drug discovery application: about 39.0% in 2025
- End user: hospitals and diagnostic laboratories hold the largest share in 2025
- Asia Pacific: highest regional CAGR in the forecast
- Players cited: Thermo Fisher, Tecan, Danaher, Agilent, Roche
- Drivers cited: high-throughput screening, skilled-labor shortage, AI and robotics advances, personalized medicine, R&D spend
- Restraints cited: high initial CapEx, slow adoption in developing regions, system integration issues, refurbished equipment competition
Grand View Research
- 2024: about USD 8.27 billion
- 2025: about USD 9.05 billion
- 2033: about USD 18.39 billion
- CAGR 2025-2033: about 9.3%
- North America largest region in 2024; Asia Pacific fastest growing, per the Grand View Research summary
Distinct from warehouse AMR and assistive robotics
This series covers laboratory automation equipment and lab-floor robotics such as plate movers and collaborative sample handlers. Warehouse mobile robots (AMR) are a different market with different suppliers and buyer economics, and we do not pull warehouse mobile-robot figures into this series. Assistive robotics is also a separate category; see our assistive robotics snapshot for that market.
Growth Drivers
- High-throughput screening needs in drug discovery and diagnostics
- Labor shortages and reproducibility pressure in clinical and research labs
- Advances in robotics, AI, and machine learning for liquid handling and scheduling
- Personalized medicine and rising R&D investment
- Pandemic-era capacity lessons and diagnostic volume growth
- Demand for modular, connectable benchtop systems versus only mega total-lab installs
Key Segments
- By product (MarketsandMarkets framing): automated workstations and liquid handling; microplate readers; automated ELISA; nucleic acid purification; off-the-shelf work cells (pre, post, and total lab automation); robotic systems (arms, track, collaborative, mobile); automated storage and retrieval; software (LIMS, ELN, LES, SDMS)
- By application: drug discovery (HTS, compound management, ADME), diagnostics (pre-analytics, immunoassays), genomics, proteomics, microbiology
- By end user: hospitals and diagnostic labs (largest per MarketsandMarkets 2025), biotech and pharma, research and academic, environmental, forensic, food and beverage
The hardware stack for product teams includes pipetting mechanisms, deck layout, tip waste paths, plate hotels, vision and alignment, enclosure access, EMI around motors and sensors, and instrument APIs. Teams often start with product design and electronic product development before locking a motion and fluidics BOM.
Where Startups Are Building
If you are still narrowing the gap, product discovery is the usual first step. The openings we see most often:
- Modular benchtop liquid handlers for specific assay classes
- Compact automated nucleic acid purification or ELISA boxes for smaller labs
- Collaborative arms and mobile manipulators that move plates between existing instruments (lab-floor, not warehouse AMR)
- Pre-analytical sample prep and decapping modules for diagnostic volume
- Open, scriptable decks aimed at academic and biotech method flexibility
- Consumable-friendly tip and plate handling that reduces jams and downtime
Risks and Constraints
- High upfront CapEx and unclear ROI for mid-size labs
- Integration pain across proprietary instruments and legacy software
- Slow adoption and service-cost burden in developing regions
- Competition from refurbished automation lines
- Regulatory validation (IQ/OQ/PQ) lengthens sales cycles for clinical use
- Scope mismatch across Fortune, MarketsandMarkets, and Grand View Research (always name the source)
Product development consulting helps stress-test deck kinematics, fluidics sealing, EMI, and landed cost before tooling.
From market size to a buildable product
Market size only shows the field is growing. Turning this report into a shippable lab automation module usually means discovery and requirements, product design and industrial design, prototyping, then manufacturing readiness.
Product discovery and requirements. Pick the wedge (liquid handler module, purification box, plate mover, pre-analytical deck) and write requirements around throughput, volume accuracy, plate formats, footprint, safety interlocks, and software API through product discovery.
Product design and industrial design. Treat pipette mechanics, tip seating, spill containment, cable routing, and service access as first-class constraints through product design and industrial design.
Prototyping. Prove volume accuracy, carryover, crash recovery, thermal drift, and MTBF on repetitive decks with rapid prototyping. The prototype cost calculator and our guide on how much a prototype costs help scope the budget.
Manufacturing readiness. DFM for precision mechanisms, supplier paths for pumps, valves, and sensors, and short-run validation for early lab customers through low-volume manufacturing. If you want a second set of eyes first, book a consultation.
- Design for serviceability and tip-jam recovery from the first layout review
- Treat volume accuracy and contamination control as product features, not firmware footnotes
- Modular benchtop systems are realistic entry points versus competing only on full total-lab automation lines
- Enclosure access and cable management decide whether lab managers will trust daily use
- Motion control, sensing, and instrument APIs usually need electronic product development alongside the mechanical stack
Key Takeaways
- Fortune Business Insights: about USD 9.2B (2025) and USD 10.07B (2026) to about USD 20.71B (2034) at 9.43% CAGR
- MarketsandMarkets: about USD 6.26B (2025) and USD 6.60B (2026) to about USD 8.62B (2031) at 6.6% CAGR; workstations about 40.2% of 2025 share
- Grand View Research: about USD 8.27B (2024) and USD 9.05B (2025) to about USD 18.39B (2033) at about 9.3% CAGR
- Drug discovery holds about 39% application share and hospitals and diagnostic labs lead end users (MarketsandMarkets 2025)
- Accessible product gaps: modular liquid handlers, compact purification and ELISA modules, collaborative plate movers
Planning a product in this space? Try the prototype cost calculator or book a consultation.
You can also apply to partner with us. Related reading: wearable medical devices, industrial inspection drones, assistive robotics (a distinct category), and the full Market Reports index.
Sources
Key metrics at a glance
Every figure below appears in the report above. The Fortune Business Insights, MarketsandMarkets, and Grand View Research series use different scopes, so they are listed separately rather than blended.
| Metric | Value | Year / Period | Source |
|---|---|---|---|
| Laboratory automation market size | USD 9.2 billion | 2025 | Fortune Business Insights |
| Laboratory automation market size | USD 10.07 billion | 2026 | Fortune Business Insights |
| Laboratory automation market size | USD 20.71 billion | 2034 | Fortune Business Insights |
| CAGR | 9.43% | 2026-2034 | Fortune Business Insights |
| Lab automation market size | USD 6.26 billion | 2025 | MarketsandMarkets |
| Lab automation market size | USD 6.60 billion | 2026 | MarketsandMarkets |
| Lab automation market size | USD 8.62 billion | 2031 | MarketsandMarkets |
| CAGR | 6.6% | 2026-2031 | MarketsandMarkets |
| Automated workstations share | 40.2% | 2025 | MarketsandMarkets |
| Drug discovery application share | 39.0% | 2025 | MarketsandMarkets |
| Lab automation market size | USD 8.27 billion | 2024 | Grand View Research |
| Lab automation market size | USD 9.05 billion | 2025 | Grand View Research |
| Lab automation market size | USD 18.39 billion | 2033 | Grand View Research |
| CAGR | ~9.3% | 2025-2033 | Grand View Research |
Table: Key lab automation metrics, with the source behind each figure.
Laboratory automation market size, 2025 to 2034
Global market size in USD billion. Only the reported points are plotted; mid-year values are not published in the summary.
Source: Fortune Business Insights, Laboratory Automation Market.
Automated workstations lead the product mix
40.2%
Automated workstations held the largest product share of the lab automation market in 2025, ahead of microplate readers, purification systems, and robotic work cells.
Source: MarketsandMarkets, product share 2025.
Questions founders ask about the lab automation market
What is the lab automation market size?
Fortune Business Insights puts the global laboratory automation market at about USD 9.2 billion in 2025. MarketsandMarkets estimates about USD 6.26 billion in 2025. Grand View Research estimates about USD 9.05 billion in 2025. Scopes differ, so name the source every time you quote a figure.
What is the lab automation market CAGR?
Fortune Business Insights projects 9.43% from 2026 through 2034. MarketsandMarkets projects 6.6% from 2026 through 2031. Grand View Research projects about 9.3% from 2025 through 2033. Do not average the series.
Which product segment leads the market?
Automated workstations hold the largest product share at about 40.2% in 2025, per MarketsandMarkets.
Is this the same as warehouse AMR or industrial mobile robots?
No. This report covers laboratory automation equipment and lab-floor robotics such as plate movers and collaborative sample handlers. Warehouse mobile robots are a different market with different suppliers and buyer economics.
Who are the major end users?
Hospitals and diagnostic laboratories hold the largest end-user share in 2025, per MarketsandMarkets. Biotech and pharma companies and research and academic institutes are also key buyers.
How does a team move from this data to a first prototype?
Why do analyst market sizes disagree?
Scope differs across firms: some count equipment only, others bundle software and services, and the clinical versus research mix varies. Always cite the specific series you are using.
Building hardware for this market
If this research is the front end of a product decision, these are the parts of the work we handle in house.
- Instrument and automation mechanics
Motion, fluid paths and precision assemblies for benchtop and workstation equipment.
- Instrument electronics and firmware
Control boards, sensing and interfaces for laboratory hardware.
- Regulated development
Design controls and documentation when the instrument touches clinical work.
Cite this report
Using these figures in a pitch deck, grant application or internal memo? Cite it as:
LA New Product Development Team (LA NPDT). "Lab Automation Equipment Market Trends (2026–2034)." 2026. https://lanpdt.com/lab-automation-equipment-market-trends-2025/
Every figure is attributed to its original source in the Sources list above. Please cite the original publisher for their own data.