
Portable Power Station Market Trends (2026–2033)
Portable power stations: Frost & Sullivan puts 2024 sales revenue at about USD 3.8B toward about USD 9.7B by 2029 at 20.6% CAGR. Grand View Research: about USD 4.18B in 2025 toward about USD 19.91B by 2033 at 22.4% CAGR. Shipments about 9.2M units in 2024 toward about 20.4M by 2029. Hardware gaps in LFP packs, BMS thermal design, modular expandability, and safer outdoor enclosures. Distinct from utility-scale BESS.
September 11, 20266 min read

Written by Konstantin Dolgan, Ph.D., NPDP
Founder & CEO, Product Development Engineer
Published September 11, 2026
A startup-usable snapshot of the portable power station market
- ~USD 3.8B to ~USD 9.7B
- Global portable power station sales revenue, 2024 to 2029, at 20.6% CAGR
- Frost & Sullivan
- ~USD 4.18B to ~USD 19.91B
- Global portable power station market, 2025 to 2033, at 22.4% CAGR
- Grand View Research
- ~9.2M to ~20.4M
- Global shipments, 2024 to 2029, at 17.3% shipment CAGR
- Frost & Sullivan
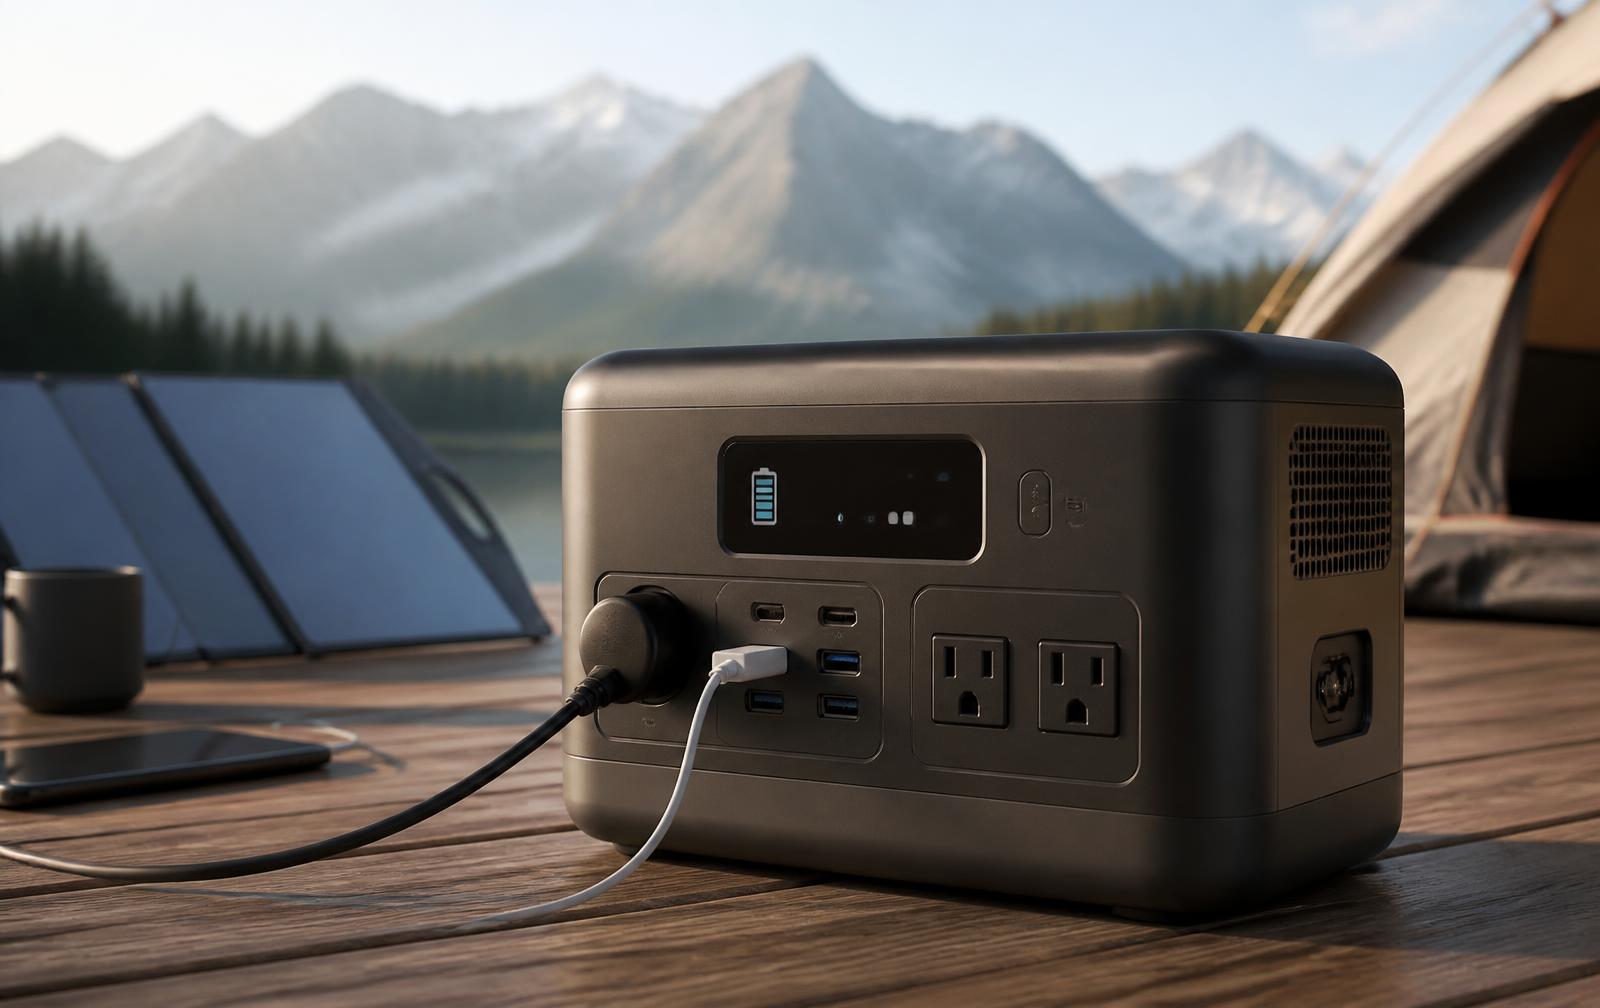
This report covers portable power stations (also called portable energy storage or solar generators): self-contained rechargeable battery systems with an inverter and multiple outlets, typically about 100Wh to about 3kWh, used for outdoor recreation, emergency home backup, vehicle backup, and field work without permanent electrical installation.
It is written for inventors, hardware startups, and product teams. It does not cover utility-scale or behind-the-meter residential wall batteries as the primary market. See the related U.S. battery energy storage snapshot for stationary storage. Some residential portable ESS reports overlap; scopes are labeled where they differ.
In one line: Frost & Sullivan reports global portable power station sales revenue of about USD 3.8 billion in 2024, projected to about USD 9.7 billion by 2029 at a 20.6% CAGR (2024-2029). Grand View Research estimates about USD 4.18 billion in 2025, about USD 4.83 billion in 2026, and about USD 19.91 billion by 2033 at a 22.4% CAGR (2026-2033). Name the source every time you cite a number.
Every figure below is traceable to a named source in the Sources section. Where series disagree, we show the range and say so. Browse all of our free reports on the Market Reports index.
Market Size and Growth
Frost & Sullivan (April 2025 report on the 2024 market)
- 2024 sales revenue: about USD 3.8 billion (includes stations and accessories per the report note)
- 2029 sales revenue: about USD 9.7 billion
- Revenue CAGR 2024-2029: 20.6%
- Historical revenue CAGR 2020-2024: 52.6%
- 2024 shipments: about 9.2 million units
- 2029 shipments: about 20.4 million units
- Shipment CAGR 2024-2029: 17.3%
- Historical shipment CAGR 2020-2024: 44.7%
- Regional shipment share 2024: North America 43.5%, Europe 25.0%, Japan 19.6%, Rest of World 11.9%
- Top-five concentration 2024: 63.1% of sales revenue and 47.9% of shipments
- EcoFlow 2024 shares: 25.8% of revenue and 17.4% of shipments (ranked first on both)
- Capacity mix: units at or above 1000Wh rose from 8% (2020) to 25% (2024); 500-1000Wh moved from 56% to 40%; under 500Wh from 36% to 35%
- Li-ion average pack price cited: about USD 463/kWh in 2015 to about USD 115/kWh in 2024
- The report notes 2025 U.S. tariff policies may slow near-term growth before design and cost improvements lift demand again
Grand View Research
- 2025: about USD 4.18 billion
- 2026: about USD 4.83 billion
- 2033: about USD 19.91 billion
- CAGR 2026-2033: 22.4%
- North America was the largest market in 2025; Asia Pacific is the fastest growing (per the GVR summary)
Residential Portable Ess Alternate Series (Gmi Via Gii)
A third series from Global Market Insights (via GII) frames the category as residential portable energy storage and values it at about USD 3.3 billion in 2024, growing to about USD 29.9 billion by 2034 at a 23.9% CAGR.
It reports the 501-1000Wh capacity band at a 47.7% share in 2024 with a 24.2% segment CAGR, and North America at a 94.3% share in 2024, expected to generate about USD 13 billion by 2034.
This series is labeled residential portable energy storage and may include a different product set than the Frost & Sullivan portable power station definition. Do not average the series.
Growth Drivers
- Grid outages and extreme weather driving home backup demand
- Outdoor recreation, camping, and RV power needs
- Declining lithium-ion and LFP costs (Frost cites pack prices falling to about USD 115/kWh in 2024)
- Quiet, emissions-free alternative to small fuel generators
- E-commerce distribution (Frost cites high e-commerce penetration in key markets)
- Solar panel pairing and higher-capacity wheeled units for home backup
- Policy context: U.S. Inflation Reduction Act and storage tax credit environment; EU Batteries Regulation; Japan Portable Energy Storage Association established in 2024 (per the Frost policy table)
Key Segments
- By capacity (Frost): sub-500Wh compact packs; 500-1000Wh mid-size; 1000Wh+ high-capacity and wheeled home-backup class (rising share)
- By chemistry: lithium-ion and increasingly LFP for cycle life and thermal stability
- By application: outdoor, emergency and home backup, vehicle and field work
- By region: North America leads shipments; Europe and Japan are large; emerging markets are growing
- Hardware stack: cells and pack design, BMS, inverter (sine quality), AC/DC/USB-C ports, solar MPPT input, displays, app and BLE, enclosures, handles and wheels, and thermal paths
Teams sizing packs and inverters often start with product design and electronic product development before locking a BOM.
Where Startups Are Building
If you are still narrowing the gap, product discovery is the usual first step. The openings we see most often:
- LFP packs with transparent cycle-life claims and robust BMS thermal design
- Modular expandable mid-capacity (about 1-3 kWh) home-backup form factors
- Quiet medical-adjacent backup (for example CPAP-friendly clean sine) without overclaiming clinical use
- Solar input optimization and foldable panel kits
- App and IoT monitoring that stays honest about what is not a grid-tied ESS
- Rugged outdoor enclosures, IP ratings, and field-serviceable connectors
- Safer chargers and clearer connector standardization
Risks and Constraints
- Price competition and margin pressure after the 2021-2023 adjustment stage described by Frost
- Tariff and trade-policy shock risk (Frost flags a 2025 U.S. tariff slowdown)
- Battery safety, UL, and transport regulations
- Spec inflation and disputed cycle-life marketing
- Confusion with permanently installed residential ESS and wall batteries
- Commodity race on sub-500Wh units
Product development consulting helps stress-test BMS, inverter EMI, enclosure thermal design, and landed cost before tooling.
From market size to a buildable product
Market size only shows the field is growing. Turning this report into a shippable portable power station usually means discovery and requirements, product design and industrial design, prototyping, then manufacturing readiness.
Product discovery and requirements. Pick the capacity band and use case (outdoor vs home backup vs field), then write requirements around Wh, continuous watts, surge watts, chemistry, cycle life, IP rating, and certification path. Our product discovery sprint is built for exactly this, and a rough market size estimate keeps the thesis honest.
Product design and industrial design. Treat pack thermal paths, BMS layout, inverter EMI, handle and wheel ergonomics, and service access as first-class constraints through product design and industrial design.
Prototyping. Prove drop and vibration, thermal soak, connector durability, solar charge behavior, and sine quality under load with rapid prototyping. The prototype cost calculator and our guide to how much a prototype costs set the budget before you commit.
Manufacturing readiness. DFM for mid-volume consumer electronics, cell supplier qualification, and short-run validation through low-volume manufacturing. If you want to talk it through first, book a consultation.
- Design LFP and BMS thermal safety from the first layout review
- Treat continuous vs surge watt ratings as product features, not marketing footnotes
- Mid-capacity modular and solar-paired systems are realistic entry points versus racing on commodity sub-500Wh units
- Enclosure IP and connector quality decide outdoor and emergency trust
- Inverter, BMS, and app work usually needs electronic product development alongside the mechanical stack
Key Takeaways
- Frost & Sullivan: about USD 3.8B (2024) to about USD 9.7B (2029) at 20.6% CAGR; shipments 9.2M to 20.4M at 17.3% CAGR
- Grand View Research: about USD 4.18B (2025) to about USD 19.91B (2033) at 22.4% CAGR
- North America led 2024 shipments at 43.5% (Frost)
- Capacity mix is shifting toward 1000Wh+ units (8% in 2020 to 25% in 2024)
- This category is distinct from utility BESS; cite the series you use
Planning a product in this space? Book a consultation or apply to partner with us. Related reading: battery energy storage, heat pumps, EV charging, e-bikes, and assistive robotics. See also our industrial product design and product development consulting pages.
Sources
Key metrics at a glance
Every figure below appears in the report above. The Frost & Sullivan, Grand View Research, and GMI series use different scopes, so they are listed separately rather than blended.
| Metric | Value | Year | Source |
|---|---|---|---|
| Portable power station sales revenue | USD 3.8 billion | 2024 | Frost & Sullivan |
| Portable power station sales revenue | USD 9.7 billion | 2029 | Frost & Sullivan |
| Revenue CAGR | 20.6% | 2024-2029 | Frost & Sullivan |
| Global shipments | 9.2 million | 2024 | Frost & Sullivan |
| Global shipments | 20.4 million | 2029 | Frost & Sullivan |
| Shipment CAGR | 17.3% | 2024-2029 | Frost & Sullivan |
| Portable power station market size | USD 4.18 billion | 2025 | Grand View Research |
| Portable power station market size | USD 4.83 billion | 2026 | Grand View Research |
| Portable power station market size | USD 19.91 billion | 2033 | Grand View Research |
| CAGR | 22.4% | 2026-2033 | Grand View Research |
| North America shipment share | 43.5% | 2024 | Frost & Sullivan |
| Europe shipment share | 25.0% | 2024 | Frost & Sullivan |
| Japan shipment share | 19.6% | 2024 | Frost & Sullivan |
| Top-five revenue concentration | 63.1% | 2024 | Frost & Sullivan |
| EcoFlow revenue share | 25.8% | 2024 | Frost & Sullivan |
| Share of units >=1000Wh | 25% | 2024 | Frost & Sullivan |
| Share of units >=1000Wh | 8% | 2020 | Frost & Sullivan |
| Residential portable ESS size (alternate) | USD 3.3 billion | 2024 | GMI via GII |
| Residential portable ESS CAGR (alternate) | 23.9% | to 2034 | GMI via GII |
| Li-ion avg pack price (cited) | USD 115/kWh | 2024 | Frost & Sullivan |
Table: Key portable power station metrics, with the source behind each figure.
Portable power station sales revenue, 2020 to 2029
Global sales revenue in USD billion. 2020 through 2024 are reported history; 2029 is the Frost & Sullivan projection.
Source: Frost & Sullivan, 2024 Global Portable Power Station Market Research Report (April 2025).
2024 regional shipment mix
Share of global portable power station shipments by region in 2024. North America leads, with Europe and Japan close behind.
Source: Frost & Sullivan, shipment share 2024.
Questions founders ask about the portable power station market
What is the portable power station market size?
Frost & Sullivan puts global portable power station sales revenue at about USD 3.8 billion in 2024. Grand View Research estimates about USD 4.18 billion in 2025 and about USD 4.83 billion in 2026. The definitions differ slightly, so name the source every time you quote a figure.
What is the portable power station market CAGR?
Frost & Sullivan projects a 20.6% revenue CAGR from 2024 through 2029 and a 17.3% shipment CAGR over the same window. Grand View Research projects a 22.4% CAGR from 2026 through 2033. Do not average the two series.
How is a portable power station different from BESS?
How many portable power stations ship each year?
Frost & Sullivan counts about 9.2 million units shipped globally in 2024, rising toward about 20.4 million units by 2029 at a 17.3% shipment CAGR.
Which regions lead portable power station demand?
Frost & Sullivan reports 2024 shipment shares of 43.5% for North America, 25.0% for Europe, 19.6% for Japan, and 11.9% for the rest of the world. Grand View Research also names North America the largest market in 2025 and Asia Pacific the fastest growing.
How does a team move from this market data to a first prototype?
Who leads the portable power station market?
Frost & Sullivan reports EcoFlow ranked first in 2024 on both revenue share (25.8%) and shipment share (17.4%), with the top five vendors holding 63.1% of sales revenue and 47.9% of shipments.
Building hardware for this market
If this research is the front end of a product decision, these are the parts of the work we handle in house.
- Battery pack and inverter electronics
Cell selection, BMS, charging and safety compliance for portable power hardware.
- Housing and thermal design
Rugged enclosures, cooling and handling worked out for real duty cycles.
- First production batch
Pilot builds, supplier sourcing and assembly documentation.
Cite this report
Using these figures in a pitch deck, grant application or internal memo? Cite it as:
LA New Product Development Team (LA NPDT). "Portable Power Station Market Trends (2026–2033)." 2026. https://lanpdt.com/portable-power-station-market-trends-2025/
Every figure is attributed to its original source in the Sources list above. Please cite the original publisher for their own data.