
U.S. Electric Bicycle (E-Bike) Market Trends (2026–2031)
U.S. e-bike market: about USD 3.8B (2025) toward about USD 5.8B (2031) at roughly 7.3% CAGR (Mordor Intelligence). LEVA/eCycleElectric: about 2.2M complete e-bike imports in 2025. Hardware gaps for startups in battery safety, cargo frames, and mid-drive systems.
September 11, 20268 min read

Written by Konstantin Dolgan, Ph.D., NPDP
Founder & CEO, Product Development Engineer
Published September 11, 2026
A startup-usable Snapshot of U.S. Electric Bicycle Hardware
- ~USD 3.8B to ~USD 5.8B
- U.S. e-bike market value, 2025 to 2031, at roughly 7.3% CAGR
- Mordor Intelligence
- ~2.2M
- Complete e-bike imports into the U.S. in 2025, up from about 1.7M in 2024
- LEVA / eCycleElectric
- ~7% vs ~53%
- E-bike share of U.S. bicycle unit sales in 2024 versus Germany
- PeopleForBikes citing ZIV
This report covers complete electric bicycles sold into the United States, including Class 1, Class 2 and Class 3 style products and cargo or utility formats. It is written for inventors, hardware startups, and product teams deciding where to build next. It does not cover e-scooters, hoverboards, or motorcycle-class vehicles.
In one line: Mordor Intelligence values the U.S. e-bike market at about USD 3.78 billion in 2025, projected to reach about USD 5.78 billion by 2031 at roughly 7.32% CAGR from 2026 to 2031.
Import analysts at LEVA and eCycleElectric estimate about 2.2 million complete e-bikes entered the U.S. in 2025, up from about 1.7 million in 2024. Dollar-size estimates from other firms run higher, so the range is shown below. Name the source every time you cite a number.
Every figure below is traceable to a named source in the Sources section. Where monitors disagree, we show the range and say so. Browse all of our free reports on the Market Reports index.
Market Size and Growth
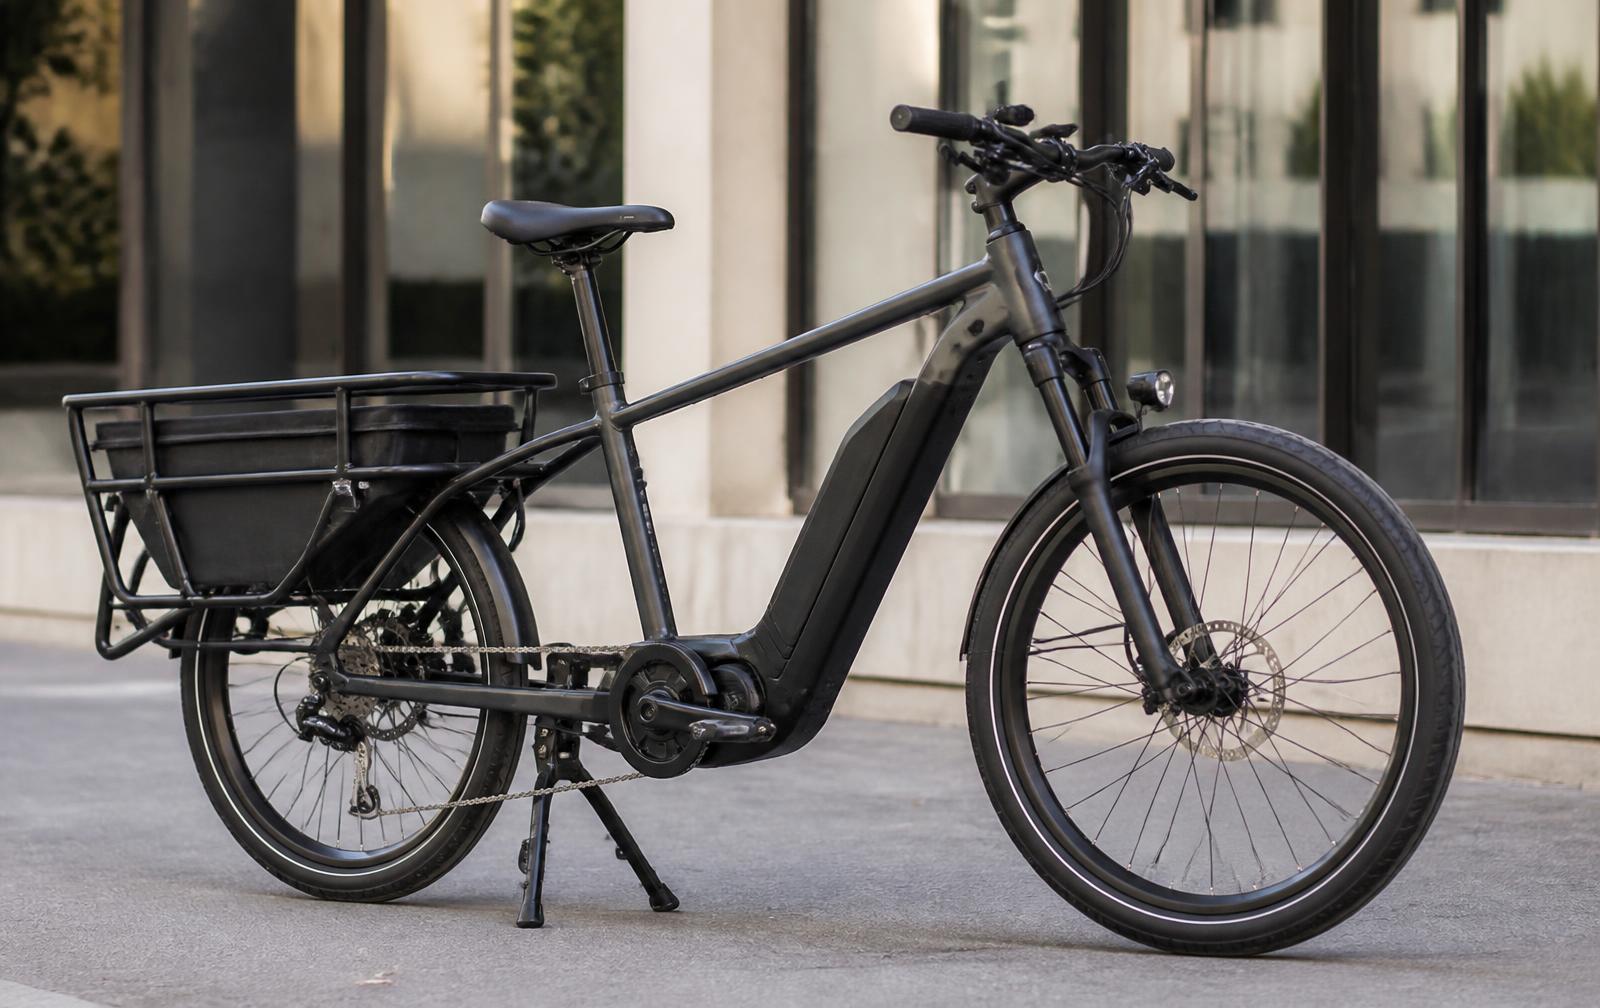
Dollar market size (named market reports)
- Mordor Intelligence (United States E-bike Market): about USD 3.78 billion in 2025, about USD 4.06 billion in 2026, about USD 5.78 billion by 2031, a CAGR of roughly 7.32% for 2026 to 2031.
- Grand View Research (U.S. e-bike market report, older series still cited publicly): about USD 1.98 billion in 2022, about USD 2.59 billion in 2023, projected about USD 7.16 billion by 2030 at about 15.6% CAGR for 2023 to 2030.
- Grand View Research Horizon outlook: about USD 3.72 billion in 2025 and about USD 9.98 billion by 2033, a CAGR of about 12.8% for 2026 to 2033.
- Market Research Future: about USD 3.90 billion in 2024, about USD 4.34 billion in 2025, and about USD 12.5 billion by 2035, a CAGR of about 11.17% for 2025 to 2035.
- Astute Analytica (non-rental electric-assisted bicycles only): about USD 1.28 billion in 2024 and about USD 5.12 billion by 2033, a CAGR of about 17.3% for 2025 to 2033.
Methodologies and scopes differ, covering the full market in some cases and non-rental assisted bikes in others, and revenue in some series versus import volume in others. For a pitch deck, pick one series and stick to it. Mordor Intelligence is the most recent detailed U.S. segment breakout used in this snapshot, while Grand View Research and Market Research Future imply a higher growth band.
Unit and channel reality (trade and industry data)
- LEVA / eCycleElectric: about 2.2 million complete e-bike imports in 2025 versus about 1.7 million in 2024, roughly 29% year over year on their series, with strong retail sell-through reported for 2025.
- Bicycle Retailer and Industry News (March 2026): Bicycle Market Research (Peter Woolery) estimates about 1.3 million e-bike imports for 2025, against the LEVA and eCycleElectric estimate of 2.2 million. Same customs-record method, different filtering of shared tariff codes. Both are shown here.
- PeopleForBikes (June 2026): conventional retail tracking missed roughly 450,000 direct-to-consumer e-bike units worth about USD 800 million in 2024, plus about 80,000 peer-to-peer marketplace units, putting nearly 1,000,000 e-bikes bought or sold in 2024 once those channels are counted.
- PeopleForBikes and Circana context: the overall U.S. bicycle market was about USD 6.6 billion in 2024, down about 8% year over year. E-bikes were about 7% of U.S. bicycle unit sales in 2024 versus about 53% in Germany, where ZIV counted about 2.05 million e-bikes of about 3.85 million total bikes.
- PeopleForBikes: the electric cargo category was estimated at about USD 100 million on roughly 38,500 units in 2024, among the fastest-growing categories. Of measured 2024 direct-to-consumer sales, 98% were throttle-equipped.
Growth Drivers
- Urban congestion and short-trip car replacement for commutes and errands.
- State and local purchase incentives and rebate programs, which vary by state.
- Quick-commerce and last-mile cargo e-bike adoption.
- Falling lithium-ion pack cost and longer range per charge.
- Protected bike-lane buildout in major metros.
- Corporate micromobility benefits and employer storage and shower amenities.
- Resale and secondary-market activity lowering the entry price, as signalled by PeopleForBikes and Upway data.
Key Segments
By propulsion (Mordor Intelligence 2025): pedal-assist leads at about 79.55%, speed pedelecs are the fastest growing propulsion type at about 8.74% CAGR through 2031, and throttle-assist remains a niche serving mobility-impaired riders and practical cargo starts. PeopleForBikes notes that 98% of measured 2024 direct-to-consumer units were throttle-equipped, which matters for Class 2 and Class 3 product and policy debates.
By application: city and urban use was about 81.99% of 2025, cargo and utility is growing at about 7.42% CAGR, and trekking or mountain formats remain a recreation niche.
By hardware stack: frames and forks, hub versus mid-drive motors, lithium-ion packs and BMS, chargers, displays and controllers, belt versus chain drivetrains, cargo racks and child seats, integrated lights and GPS theft tracking, plus enclosures and thermal paths for battery safety. Teams sizing motor mounts, battery enclosures, or controller boards often start with product design and electronic product development before locking a BOM.
Where Startups Are Building
The categories below are product openings, not a ranked company list. If you are still narrowing which gap to own, product discovery is the usual first step from market map to requirements.
- UL-ready battery packs, BMS, and tamper-resistant enclosures on a UL 2849 and UL 2271 path
- Cargo and utility frames with mid-drive integration for last-mile fleets
- Safer chargers with reverse-polarity and thermal post-discharge protections aligned with emerging CPSC proposals
- Quiet belt-drive premium commuters and serviceable modular packs
- Theft-resistant GPS and locking motor features for dense cities
- Fleet telemetry and battery-swap logistics hardware for delivery operations
- Right-sized Class 1 trail-legal versus Class 3 speed-pedelec SKUs with clear labeling
Risks and Constraints
- Lithium-ion fire risk and tightening safety expectations. The CPSC advanced a Notice of Proposed Rulemaking referencing UL 2849 for e-bike electrical systems, UL 2272 for other micromobility products, and UL 2271 for light electric vehicle batteries, with proposed additions such as tamper-resistant enclosures, post-discharge charge limits, and reverse-polarity testing (Federal Register docket coverage, mid-2026). PeopleForBikes recommends manufacturers pursue UL 2849 and UL 2271 compliance now, even while federal timing remains unsettled.
- Patchwork rules. Class 1, Class 2 and Class 3 speed and throttle rules differ across states and cities.
- High upfront price versus conventional bikes, plus financing and insurance friction.
- Import-code ambiguity and competing unit estimates, 1.3 million versus 2.2 million for 2025.
- Sparse dedicated public e-bike charging outside leading metros.
- Brand consolidation after the pandemic inventory glut, with warranty and service quality acting as competitive filters. Product development consulting helps stress-test a hardware plan against the UL path, class labeling, and landed cost before tooling.
From market size to a buildable product
Market size and import counts only show that the field is growing. Turning this report into a shippable e-bike product usually means walking a clear path: discovery and requirements, product design and industrial design, prototyping, then manufacturing readiness.
Product discovery and requirements. Start from the segment you can serve (certified packs, cargo frames, mid-drive integration, chargers, fleet telemetry) and write requirements around class labeling, payload, range, service access, and the UL path you intend to certify against. Product discovery and a rough market size estimate keep the thesis honest before CAD begins.
Product design and industrial design. Layout reviews should treat battery enclosure weld and tamper design, BMS thermal limits, mid-drive torque mounts, and cargo rack load paths as first-class constraints, not late polish. Product design and industrial design lock the envelope and the interfaces riders and mechanics actually touch.
Prototyping. Build to answer real failure-mode questions: charger incompatibility defenses, connector polarity, vibration on a loaded cargo rack, and heat paths around the pack. Rapid prototyping plus an early budget check with the prototype cost calculator or our guide to how much a prototype costs keeps iterations intentional.
Manufacturing readiness. DFM for hub versus mid-drive assemblies, supplier paths for cells and controllers, and short-run validation decide whether a pilot can scale. Low-volume manufacturing is where BOM risk shows up before you commit tooling. If you want a second set of eyes on the plan, book a consultation.
- Design for UL 2849 and UL 2271 from the first layout review, covering enclosure, BMS, and charger pairing.
- Treat class labeling and throttle behavior as product features, not paperwork.
- Cargo and mid-drive systems are realistic entry points versus competing only on commodity city hub bikes.
- Thermal management and tamper resistance decide whether retailers and cities will stock you.
- Online-first brands still need serviceable hardware and dealer-friendly diagnostics.
- Controller, display and telemetry work usually needs electronic product development alongside the mechanical stack.
Key Takeaways
- Mordor Intelligence: about USD 3.78 billion in 2025 heading toward about USD 5.78 billion in 2031, a CAGR of about 7.32% for 2026 to 2031.
- A higher-growth alternate band exists, such as the older Grand View Research series at about 15.6% CAGR to about USD 7.16 billion by 2030. Cite whichever series you use.
- LEVA and eCycleElectric: about 2.2 million complete imports in 2025 versus about 1.7 million in 2024, with a Bicycle Market Research alternate of about 1.3 million.
- PeopleForBikes: direct-to-consumer and peer-to-peer channels put 2024 closer to 1 million units traded, and U.S. e-bike unit share was about 7% versus about 53% in Germany.
- Accessible product gaps: certified packs and BMS, cargo frames, mid-drive integration, safer chargers, and fleet telemetry.
- Budgeting an early build? Use the prototype cost calculator or book a consultation with an engineer.
If you want a second set of eyes on an e-bike hardware thesis, book a consultation or apply to partner. Related pages: industrial product design and development and product development consulting. Related snapshots: U.S. BESS, heat pumps, EV charging, assistive robotics, and vertical farming.
Sources
- Mordor Intelligence, United States E-bike Market: mordorintelligence.com/.../united-states-e-bike-market
- Grand View Research, U.S. E-bike Market: grandviewresearch.com/.../us-e-bike-market-report
- Grand View Horizon, U.S. E-bikes outlook: grandviewresearch.com/horizon/.../united-states
- Market Research Future, US Electric Bicycles: marketresearchfuture.com/.../us-electric-bicycles-market-54380
- Astute Analytica via GlobeNewswire, non-rental electric-assisted bicycles (March 28, 2025): globenewswire.com/.../astute-analytica
- LEVA, USA imports of electric bikes in 2025 top 2.2 million units: levassociation.com/.../2-2-million-units
- eCycleElectric, 2025 import blog post: ecycleelectric.com/blog/.../top-22-million-units
- Bicycle Retailer and Industry News on import estimates: bicycleretailer.com/industry-news/2026/03/10
- PeopleForBikes, The U.S. E-Bike Market Is Bigger Than the Numbers Show: peopleforbikes.org/news/e-bike-market-bigger-than-numbers-show
- PeopleForBikes, CPSC update and UL guidance: peopleforbikes.org/news/cpsc-update-from-peopleforbikes
- Federal Register, CPSC micromobility lithium-ion battery NPR (2026-12749): federalregister.gov/documents/2026/06/24/2026-12749
Key metrics at a glance
Every figure below appears in the report above. Dollar size and import units come from different source families, and 2025 imports are disputed, so both estimates are shown.
| Metric | Value | Year | Source |
|---|---|---|---|
| U.S. e-bike market size | USD 3.78 billion | 2025 | Mordor Intelligence |
| U.S. e-bike market size | USD 4.06 billion | 2026 | Mordor Intelligence |
| U.S. e-bike market size | USD 5.78 billion | 2031 | Mordor Intelligence |
| U.S. e-bike CAGR | 7.32% | 2026-2031 | Mordor Intelligence |
| Alternate U.S. size (older series) | USD 7.16 billion | 2030 | Grand View Research |
| Alternate U.S. CAGR (older series) | 15.6% | 2023-2030 | Grand View Research |
| Complete e-bike imports | ~1.7 million | 2024 | LEVA / eCycleElectric |
| Complete e-bike imports | ~2.2 million | 2025 | LEVA / eCycleElectric |
| Alternate import estimate | ~1.3 million | 2025 | Bicycle Market Research via BRAIN |
| Pedal-assist share | 79.55% | 2025 | Mordor Intelligence |
| City / urban share | 81.99% | 2025 | Mordor Intelligence |
| Li-ion battery share | 92.60% | 2025 | Mordor Intelligence |
| Online channel share | 55.15% | 2025 | Mordor Intelligence |
| E-bike share of U.S. bike units | ~7% | 2024 | PeopleForBikes |
| E-bike share of German bike units | ~53% | 2024 | ZIV via PeopleForBikes |
| DTC e-bike units missed by retail trackers | ~450,000 (~USD 800M) | 2024 | PeopleForBikes |
| Cargo category (estimate) | ~USD 100M / ~38,500 units | 2024 | PeopleForBikes |
Table: Key U.S. e-bike metrics, with the source behind each figure.
2025 segment shares
Base year 2025 shares of the U.S. e-bike market. Each bar is a separate segmentation, so the values do not add up to 100%.
Source: Mordor Intelligence, United States E-bike Market (base year 2025 shares).
Complete e-bike imports, 2024 to 2025
Import volume of complete e-bikes into the United States, in millions of units, on the LEVA and eCycleElectric customs series.
Source: LEVA and eCycleElectric. Bicycle Market Research, via Bicycle Retailer and Industry News, estimates about 1.3 million for 2025 using the same customs records with different code filtering.
Questions founders ask about the U.S. e-bike market
What is the U.S. e-bike market size?
Mordor Intelligence values the U.S. e-bike market at about USD 3.78 billion in 2025, about USD 4.06 billion in 2026, and about USD 5.78 billion by 2031. Other firms publish higher series on different scopes, such as Grand View Research at about USD 7.16 billion by 2030 and Market Research Future at about USD 12.5 billion by 2035. Name the source whenever you quote a figure.
What is the U.S. e-bike CAGR?
Mordor Intelligence projects about 7.32% from 2026 through 2031. Grand View Research's older U.S. series implies about 15.6% from 2023 through 2030, and its Horizon outlook about 12.8% from 2026 through 2033. The gap comes from different base years, scopes (full market versus non-rental assisted bikes) and how direct-to-consumer channels are counted.
How many e-bikes were imported into the U.S. in 2025?
LEVA and eCycleElectric estimate about 2.2 million complete e-bikes in 2025, up from about 1.7 million in 2024. Bicycle Market Research, reported by Bicycle Retailer and Industry News in March 2026, puts the same year closer to 1.3 million. Both read customs records, but they filter shared tariff codes differently, so treat 2025 as a range.
Which U.S. e-bike segments dominate?
Using Mordor Intelligence 2025 shares: pedal-assisted propulsion about 79.55%, city and urban applications about 81.99%, lithium-ion batteries about 92.60%, hub motor placement about 64.34%, chain drive about 82.73%, online sales channel about 55.15%, and personal or family end use about 62.31%. Speed pedelecs are the fastest growing propulsion type at about 8.74% CAGR through 2031, and cargo or utility applications grow at about 7.42%.
What safety standards matter for e-bike hardware?
UL 2849 covers e-bike electrical systems, UL 2271 covers light electric vehicle batteries, and UL 2272 covers other micromobility products.
The CPSC advanced a Notice of Proposed Rulemaking referencing those standards, with proposed additions such as tamper-resistant enclosures, post-discharge charge limits and reverse-polarity testing. Federal timing is not settled, so no final mandate date should be claimed. PeopleForBikes recommends pursuing UL 2849 and UL 2271 compliance now.
How does a team move from this market data into a first prototype?
Is the U.S. e-bike market saturated compared with Europe?
Not by unit share. PeopleForBikes, citing ZIV, reports e-bikes at about 7% of U.S. bicycle unit sales in 2024 against about 53% in Germany, where roughly 2.05 million of about 3.85 million bikes sold were electric. The runway is in the gap between those two numbers.
Building hardware for this market
If this research is the front end of a product decision, these are the parts of the work we handle in house.
- Battery, BMS and motor controls
Electronics design with UL 2849 and UL 2271 requirements built in from the start.
- Rideable prototypes
Frames, mounts and enclosures you can actually test on the road.
- Pilot production
First batches, supplier qualification and assembly documentation.
Cite this report
Using these figures in a pitch deck, grant application or internal memo? Cite it as:
LA New Product Development Team (LA NPDT). "U.S. Electric Bicycle (E-Bike) Market Trends (2026–2031)." 2026. https://lanpdt.com/us-e-bike-market-trends-2025/
Every figure is attributed to its original source in the Sources list above. Please cite the original publisher for their own data.